33
/
AIzaSyAYiBZKx7MnpbEhh9jyipgxe19OcubqV5w
August 1, 2025
48996
Middle East & North Africa (excluding high income)
MNA
false
2
1
GDP (current US$)
2015,2014,2013,2012,2011,2010,2009,2008,2007,2006,2005,2004,2003,2002,2001,2000,1999,1998,1997,1996,1995,1994
Download
Global statistics library →Middle East & North Africa (excluding high income) →

GDP (current US$)

This statistics in other country:

AfghanistanAlbaniaAlgeriaAndorraAngolaAntigua and BarbudaArab WorldArgentinaArmeniaArubaAustraliaAustriaAzerbaijanBahamas, TheBahrainBangladeshBarbadosBelarusBelgiumBelizeBeninBermudaBhutanBoliviaBosnia and HerzegovinaBotswanaBrazilBrunei DarussalamBulgariaBurkina FasoBurundiCabo VerdeCambodiaCameroonCanadaCaribbean small statesCayman IslandsCentral African RepublicCentral Europe and the BalticsChadChannel IslandsChileChinaColombiaComorosCongo, Dem. Rep.Congo, Rep.Costa RicaCote d'IvoireCroatiaCubaCyprusCzech RepublicDenmarkDjiboutiDominicaDominican RepublicEarly-demographic dividendEast Asia & PacificEast Asia & Pacific (excluding high income)East Asia & Pacific (IDA & IBRD countries)EcuadorEgypt, Arab Rep.El SalvadorEquatorial GuineaEritreaEstoniaEthiopiaEuro areaEurope & Central AsiaEurope & Central Asia (excluding high income)Europe & Central Asia (IDA & IBRD countries)European UnionFaroe IslandsFijiFinlandFragile and conflict affected situationsFranceFrench PolynesiaGabonGambia, TheGeorgiaGermanyGhanaGreeceGreenlandGrenadaGuatemalaGuineaGuinea-BissauGuyanaHaitiHeavily indebted poor countries (HIPC)High incomeHondurasHong Kong SAR, ChinaHungaryIBRD onlyIcelandIDA & IBRD totalIDA blendIDA onlyIDA totalIndiaIndonesiaIran, Islamic Rep.IraqIrelandIsle of ManIsraelItalyJamaicaJapanJordanKazakhstanKenyaKiribatiKorea, Rep.KosovoKuwaitKyrgyz RepublicLao PDRLate-demographic dividendLatin America & Caribbean Latin America & Caribbean (excluding high income)Latin America & the Caribbean (IDA & IBRD countries)LatviaLeast developed countries: UN classificationLebanonLesothoLiberiaLibyaLiechtensteinLithuaniaLow & middle incomeLow incomeLower middle incomeLuxembourgMacao SAR, ChinaMacedonia, FYRMadagascarMalawiMalaysiaMaldivesMaliMaltaMarshall IslandsMauritaniaMauritiusMexicoMicronesia, Fed. Sts.Middle East & North AfricaMiddle East & North Africa (excluding high income)Middle East & North Africa (IDA & IBRD countries)Middle incomeMoldovaMonacoMongoliaMontenegroMoroccoMozambiqueMyanmarNamibiaNauruNepalNetherlandsNew CaledoniaNew ZealandNicaraguaNigerNigeriaNorth AmericaNorwayOECD membersOmanOther small statesPacific island small statesPakistanPalauPanamaPapua New GuineaParaguayPeruPhilippinesPolandPortugalPost-demographic dividendPre-demographic dividendPuerto RicoQatarRomaniaRussian FederationRwandaSamoaSan MarinoSao Tome and PrincipeSaudi ArabiaSenegalSerbiaSeychellesSierra LeoneSingaporeSlovak RepublicSloveniaSmall statesSolomon IslandsSomaliaSouth AfricaSouth AsiaSouth Asia (IDA & IBRD)South SudanSpainSri LankaSt. Kitts and NevisSt. LuciaSt. Vincent and the GrenadinesSub-Saharan Africa Sub-Saharan Africa (excluding high income)Sub-Saharan Africa (IDA & IBRD countries)SudanSurinameSwazilandSwedenSwitzerlandSyrian Arab RepublicTajikistanTanzaniaThailandTimor-LesteTogoTongaTrinidad and TobagoTunisiaTurkeyTurkmenistanTuvaluUgandaUkraineUnited Arab EmiratesUnited KingdomUnited StatesUpper middle incomeUruguayUzbekistanVanuatuVenezuela, RBVietnamVirgin Islands (U.S.)West Bank and GazaWorldYemen, Rep.ZambiaZimbabwe

Timeline:

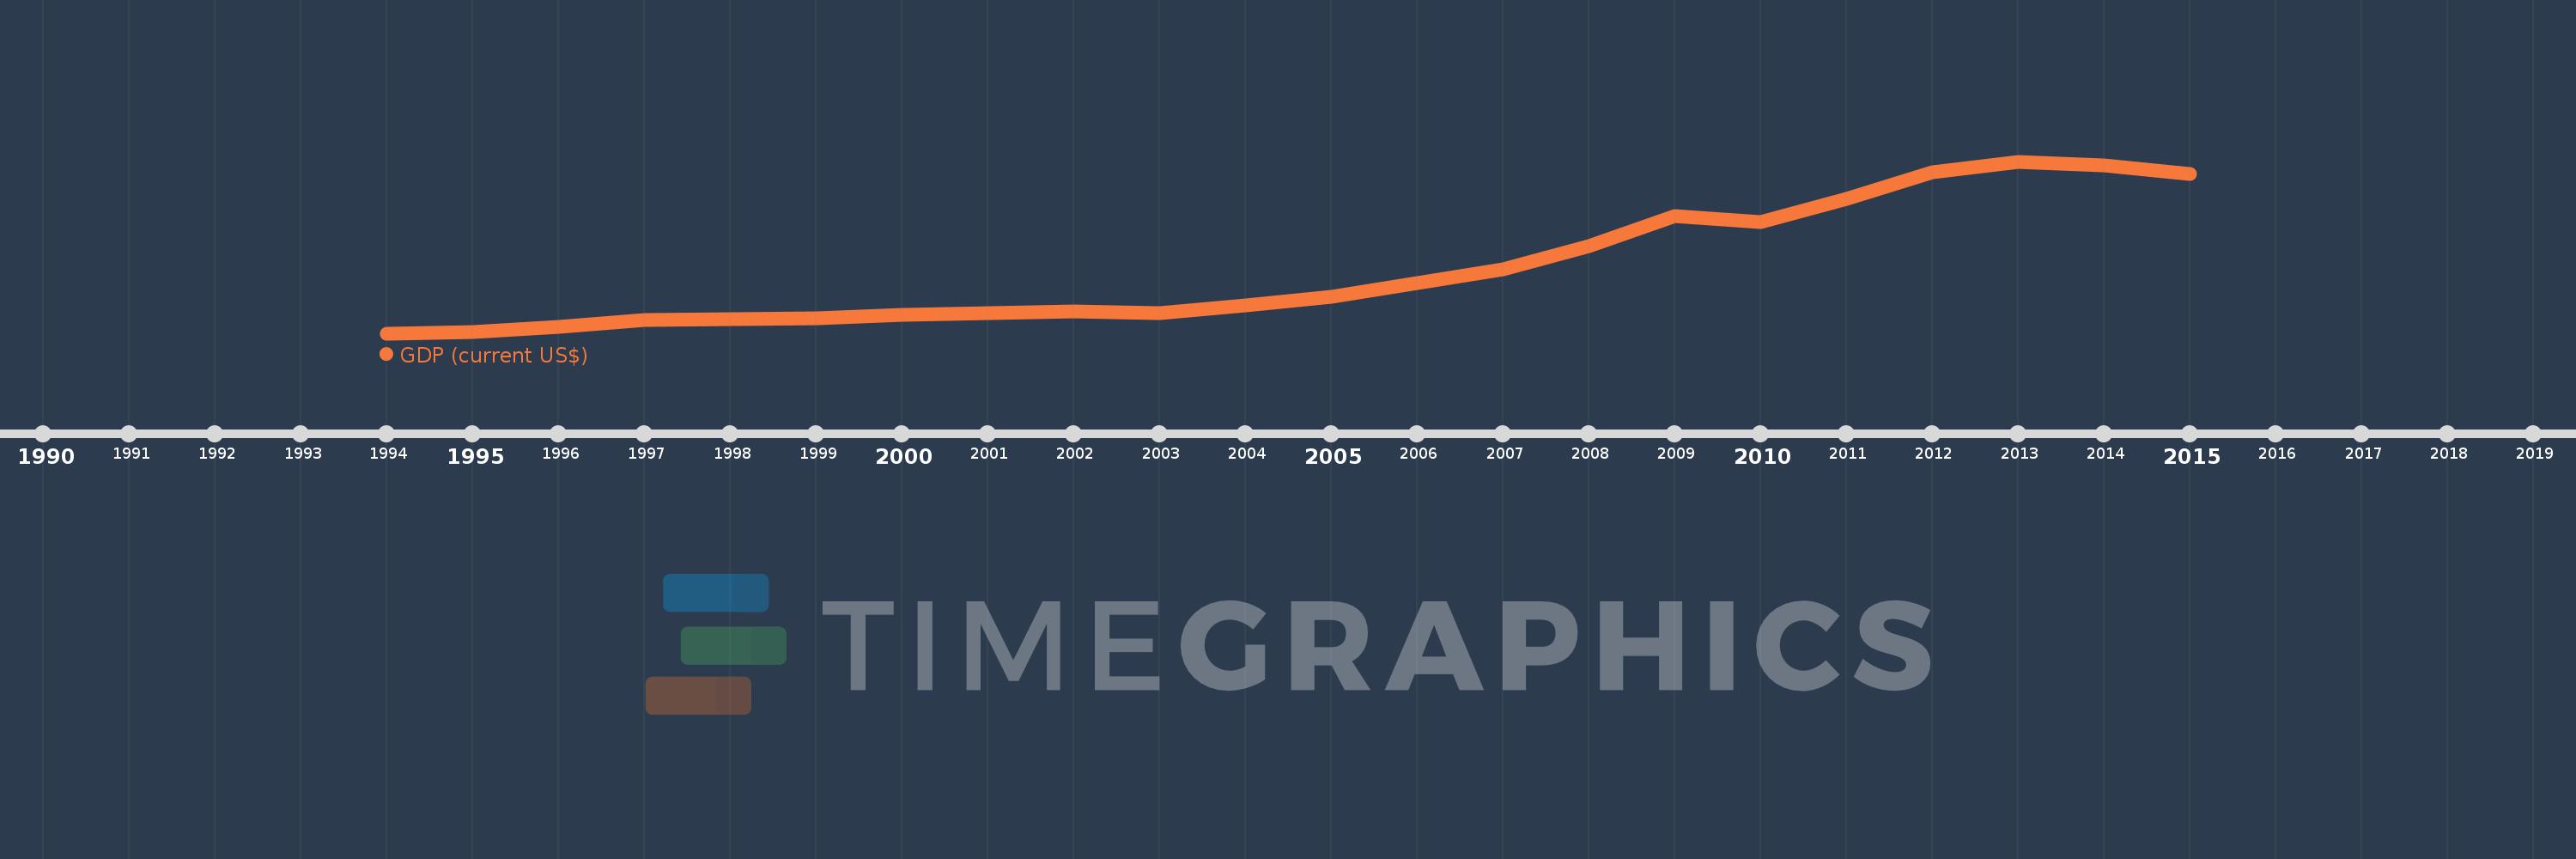
This timeline shows a graph from 1994 to 2015 of Middle East & North Africa (excluding high income). No data until 1993. Number of actual observations by date: 22.

Source name:

World Development Indicators

Source organization:

World Bank national accounts data, and OECD National Accounts data files.

Categories, topics:

Economy & Growth

Last updated:

apr 23, 2017

Indicators value changes by year

Meaning:
806.822 bln
Minimum:
291.596 bln
jan 1, 1994
Maximum:
1.665 trl
jan 1, 2013
At the date of observation
Value
Absolute change
Change from the previous value
jan 1, 1994
291.596 bln
+291.596 bln
0.0%
jan 1, 1995
299.034 bln
+7.437 bln
2.55%
jan 1, 1996
341.005 bln
+41.972 bln
14.04%
jan 1, 1997
395.42 bln
+54.414 bln
15.96%
jan 1, 1998
406.14 bln
+10.721 bln
2.71%
jan 1, 1999
412.225 bln
+6.085 bln
1.5%
jan 1, 2000
435.963 bln
+23.738 bln
5.76%
jan 1, 2001
451.743 bln
+15.779 bln
3.62%
jan 1, 2002
467.441 bln
+15.699 bln
3.48%
jan 1, 2003
453.762 bln
-13.68 bln
-2.93%
jan 1, 2004
511.875 bln
+58.113 bln
12.81%
jan 1, 2005
586.24 bln
+74.365 bln
14.53%
jan 1, 2006
691.427 bln
+105.187 bln
17.94%
jan 1, 2007
803.273 bln
+111.846 bln
16.18%
jan 1, 2008
989.863 bln
+186.59 bln
23.23%
jan 1, 2009
1.226 trl
+235.803 bln
23.82%
jan 1, 2010
1.18 trl
-45.883 bln
-3.74%
jan 1, 2011
1.363 trl
+183.152 bln
15.52%
jan 1, 2012
1.577 trl
+214.503 bln
15.74%
jan 1, 2013
1.665 trl
+87.489 bln
5.55%
jan 1, 2014
1.634 trl
-30.751 bln
-1.85%
jan 1, 2015
1.568 trl
-66.025 bln
-4.04%

Ranking of countries by current statistics by years