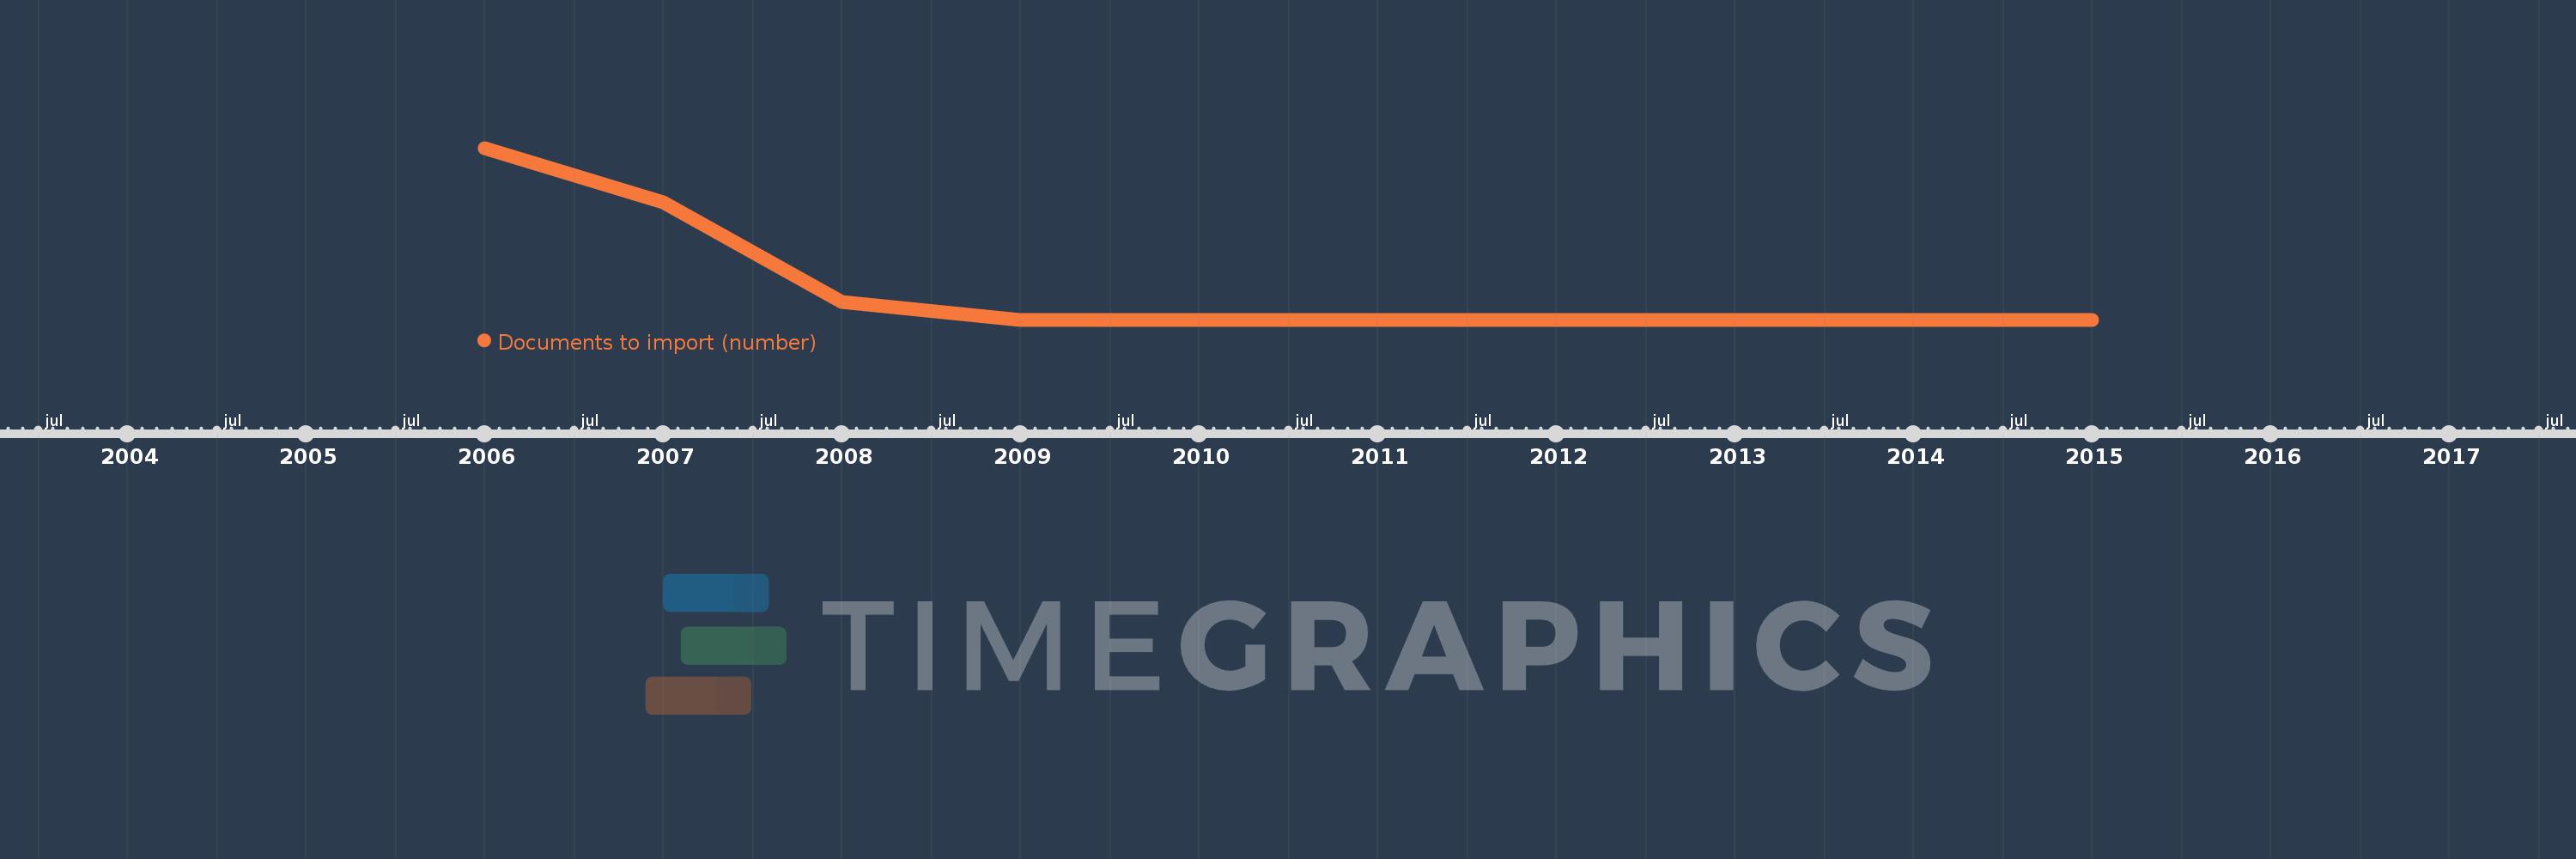
This timeline shows a graph from 2006 to 2015 of Middle East & North Africa (excluding high income). No data until 2005. Number of actual observations by date: 10.
Source name:
World Development Indicators
Source organization:
World Bank, Doing Business project (http://www.doingbusiness.org/).
Categories, topics:
Private Sector, Trade
Last updated:
apr 23, 2017
Indicators value changes by year
Meaning:
8.2
Minimum:
7.917
jan 1, 2009
Maximum:
9.5
jan 1, 2006
At the date of observation
Value
Absolute change
Change from the previous value
jan 1, 2006
9.5
+9.5
0.0%
jan 1, 2007
9.0
-0.5
-5.26%
jan 1, 2008
8.083
-0.917
-10.19%
jan 1, 2009
7.917
-0.167
-2.06%
jan 1, 2010
7.917
0.0
0.0%
jan 1, 2011
7.917
0.0
0.0%
jan 1, 2012
7.917
0.0
0.0%
jan 1, 2013
7.917
0.0
0.0%
jan 1, 2014
7.917
0.0
0.0%
jan 1, 2015
7.917
0.0
0.0%
Ranking of countries by current statistics by years