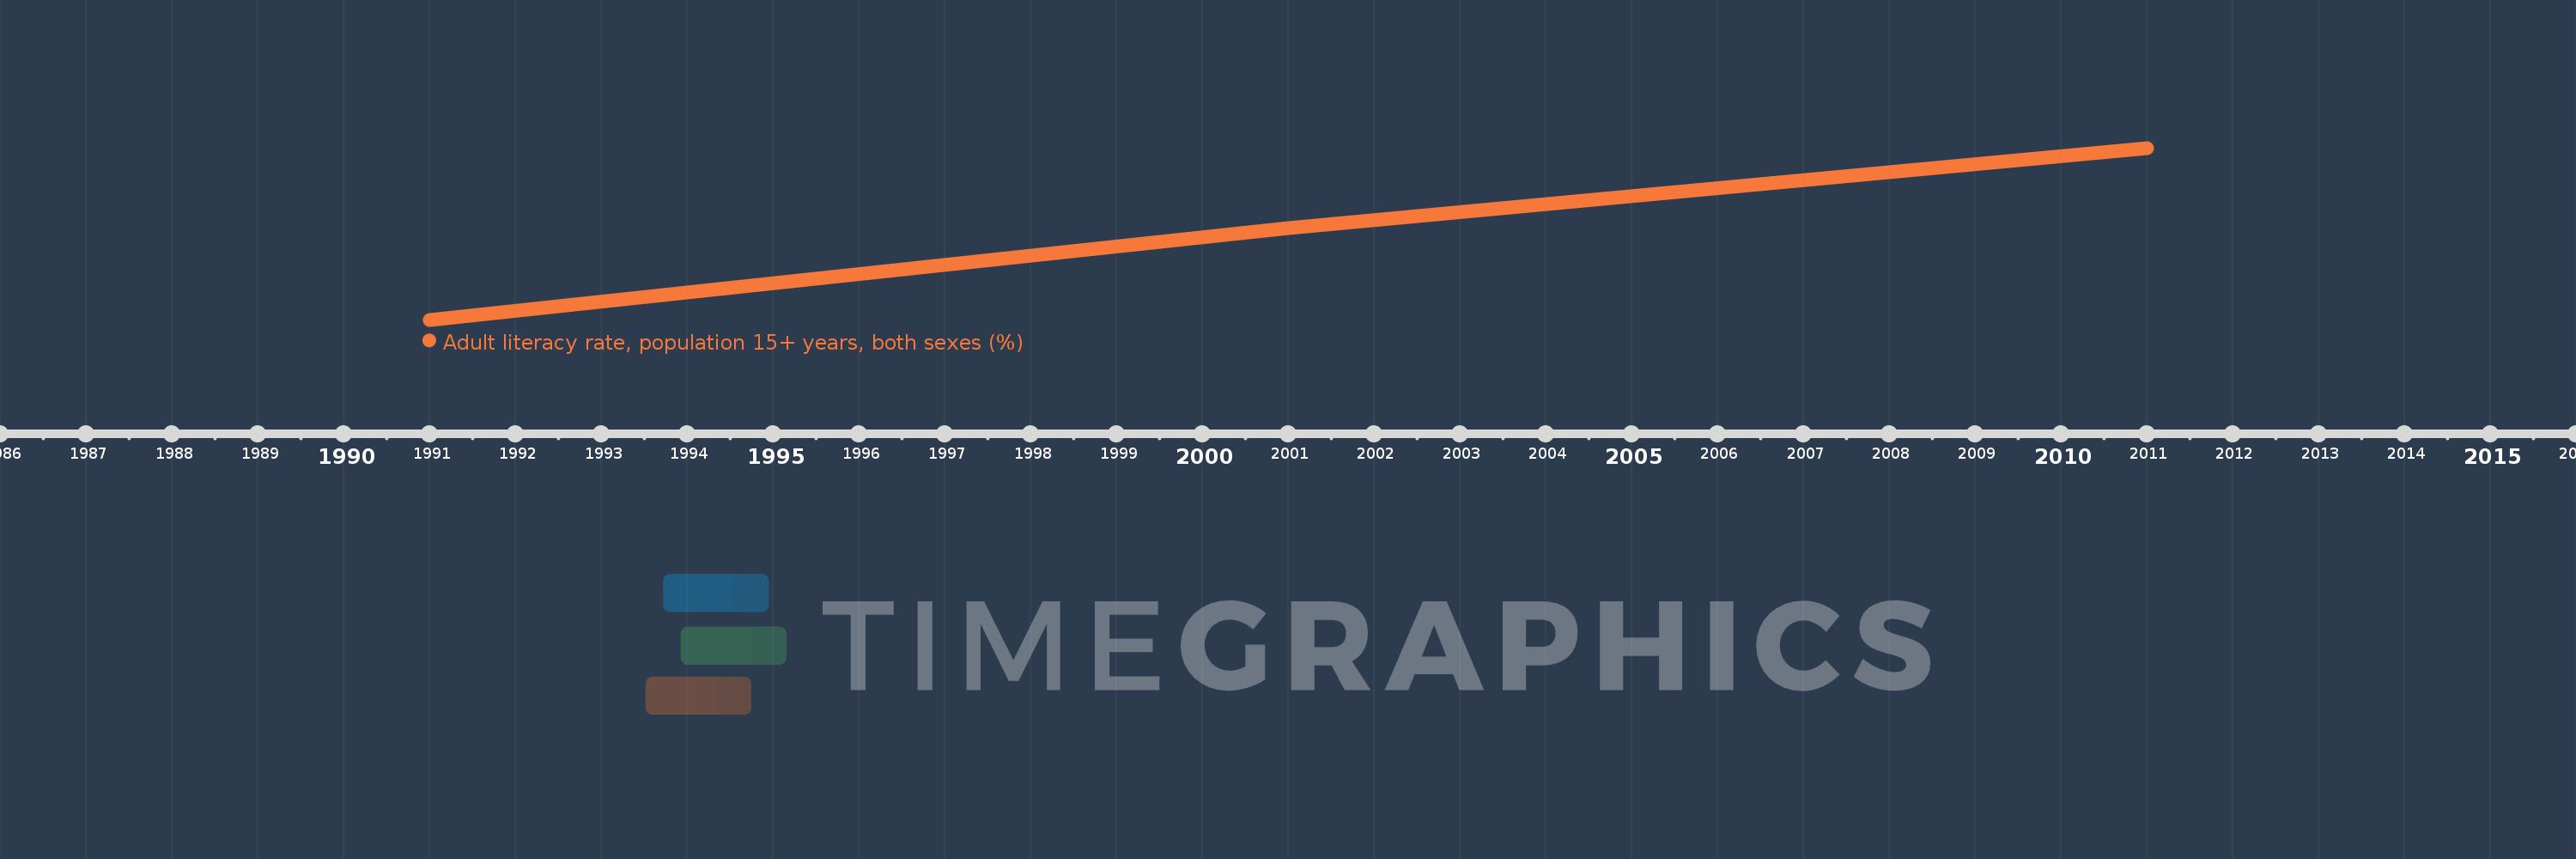
This timeline shows a graph from 1991 to 2011 of Middle East & North Africa (excluding high income). No data until 1990. Number of actual observations by date: 3.
Source name:
World Development Indicators
Source organization:
UNESCO Institute for Statistics
Categories, topics:
Education
Last updated:
apr 23, 2017
Indicators value changes by year
Meaning:
67.501
Minimum:
56.039
jan 1, 1991
Maximum:
78.439
jan 1, 2011
At the date of observation
Value
Absolute change
Change from the previous value
jan 1, 1991
56.039
+56.039
0.0%
jan 1, 2001
68.024
+11.984
21.39%
jan 1, 2011
78.439
+10.415
15.31%
Ranking of countries by current statistics by years