Download This statistics in other country:
Timeline:
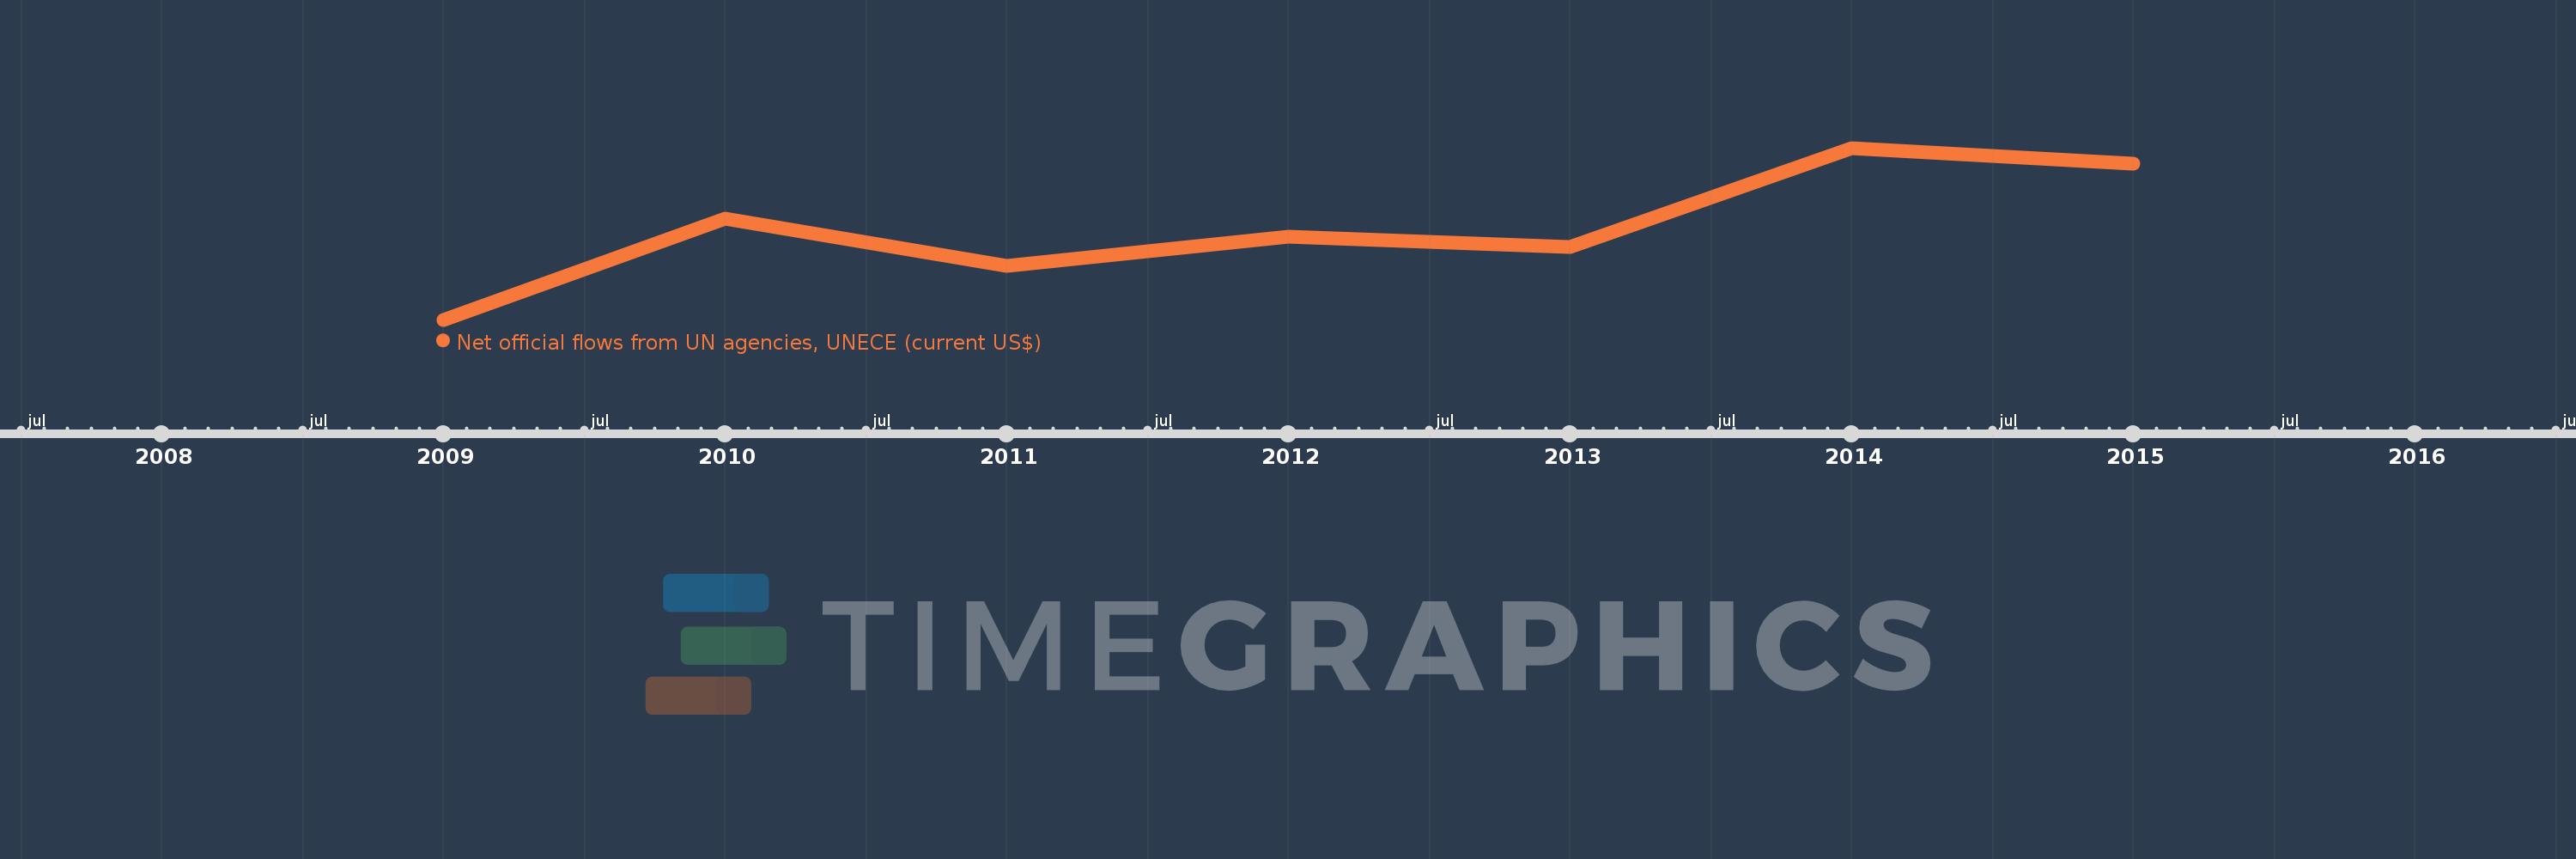
This timeline shows a graph from 2009 to 2015 of Low & middle income. No data until 2008. Number of actual observations by date: 7.
Source name:
World Development Indicators
Source organization:
Development Assistance Committee of the Organisation for Economic Co-operation and Development, Geographical Distribution of Financial Flows to Developing Countries, Development Co-operation Report, and International Development Statistics database. Data are available online at: www.oecd.org/dac/stats/idsonline.
Categories, topics:
Aid Effectiveness
Last updated:
apr 23, 2017
Indicators value changes by year
Minimum:
10.8 mln
jan 1, 2009
Maximum:
14.29 mln
jan 1, 2014
At the date of observation
Value
Absolute change
Change from the previous value
jan 1, 2009
10.8 mln
+10.8 mln
0.0%
jan 1, 2010
12.86 mln
+2.06 mln
19.07%
jan 1, 2011
11.89 mln
-970.0K
-7.54%
jan 1, 2012
12.49 mln
+600.0K
5.05%
jan 1, 2013
12.28 mln
-210.0K
-1.68%
jan 1, 2014
14.29 mln
+2.01 mln
16.37%
jan 1, 2015
13.97 mln
-320.0K
-2.24%
Ranking of countries by current statistics by years