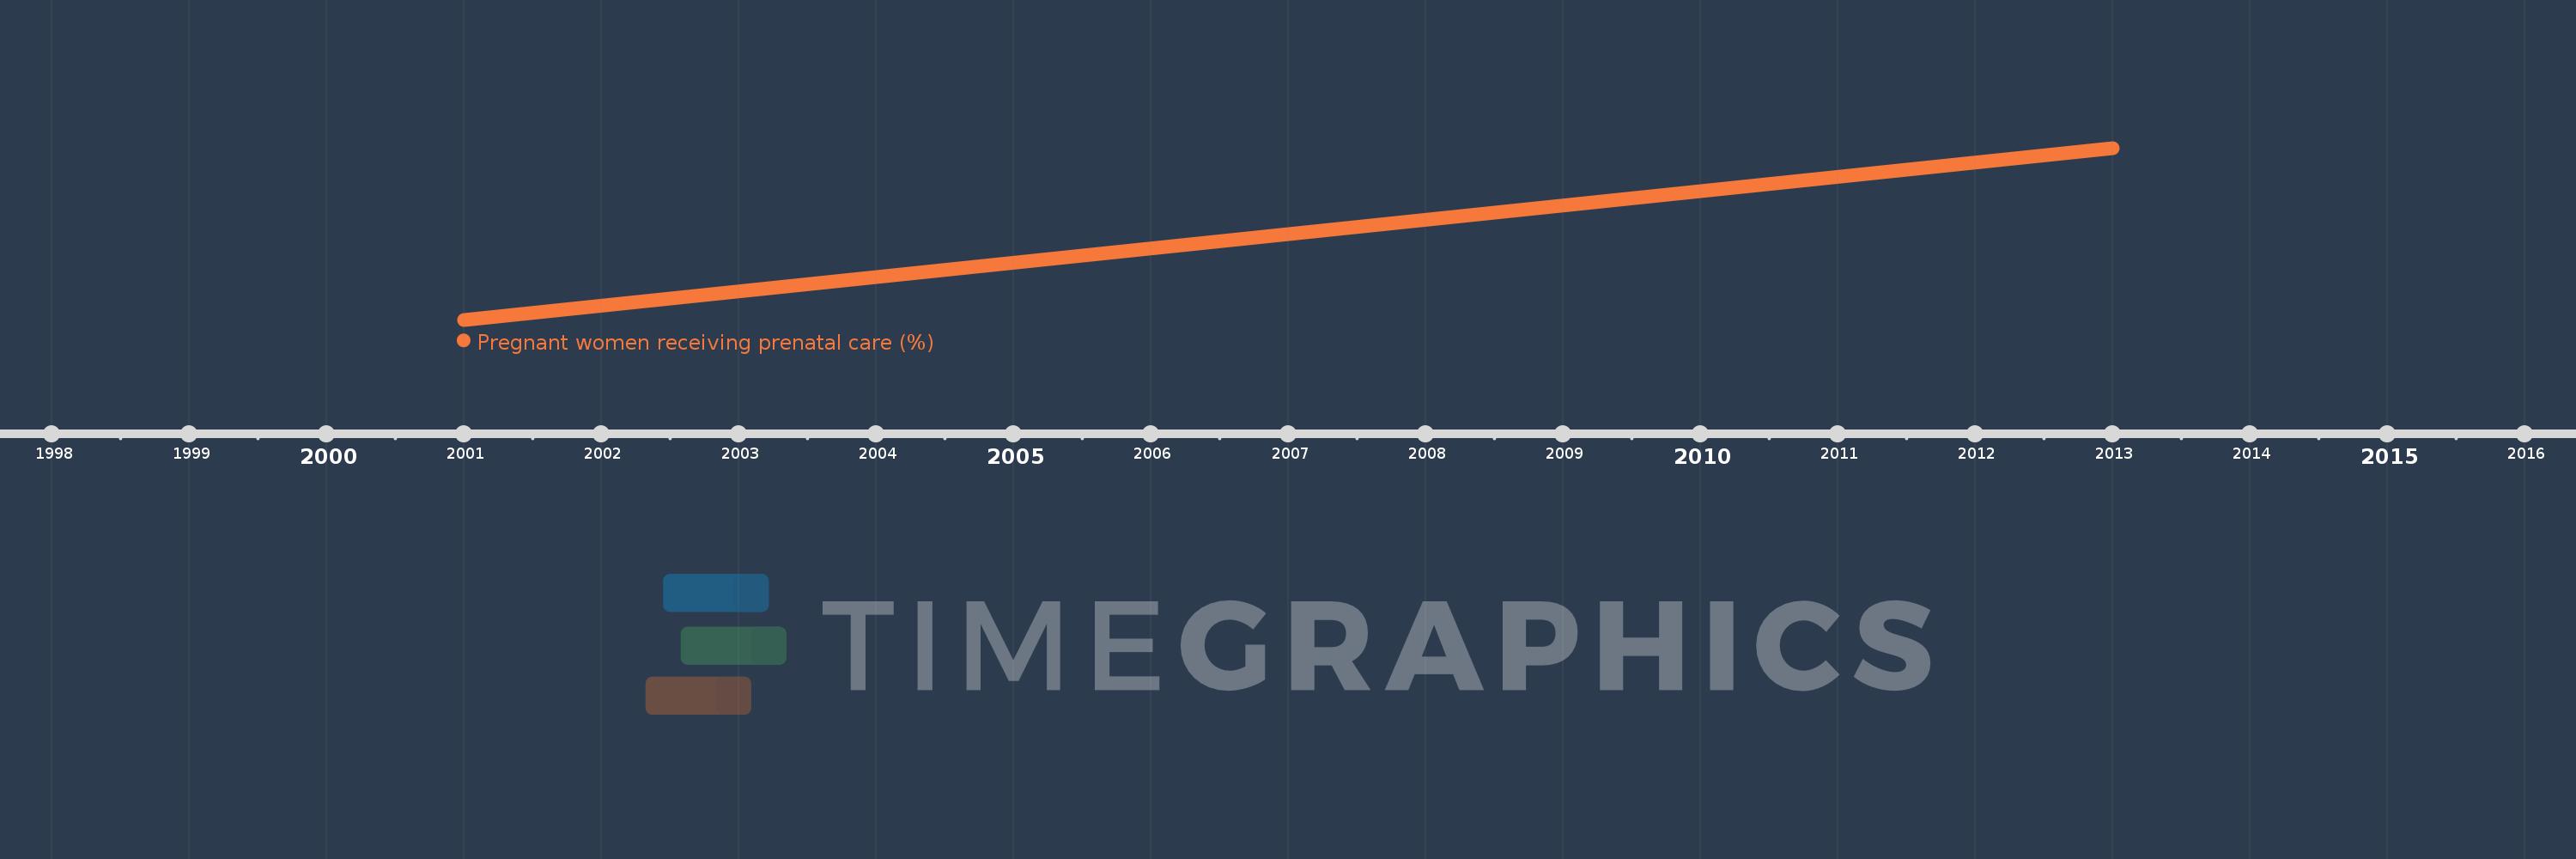
This timeline shows a graph from 2001 to 2013 of Least developed countries: UN classification. No data until 2000. Number of actual observations by date: 2.
Source name:
World Development Indicators
Source organization:
UNICEF, State of the World's Children, Childinfo, and Demographic and Health Surveys.
Categories, topics:
Health, Gender, Aid Effectiveness
Last updated:
apr 23, 2017
Indicators value changes by year
Meaning:
65.516
Minimum:
54.913
jan 1, 2001
Maximum:
76.119
jan 1, 2013
At the date of observation
Value
Absolute change
Change from the previous value
jan 1, 2001
54.913
+54.913
0.0%
jan 1, 2013
76.119
+21.206
38.62%
Ranking of countries by current statistics by years