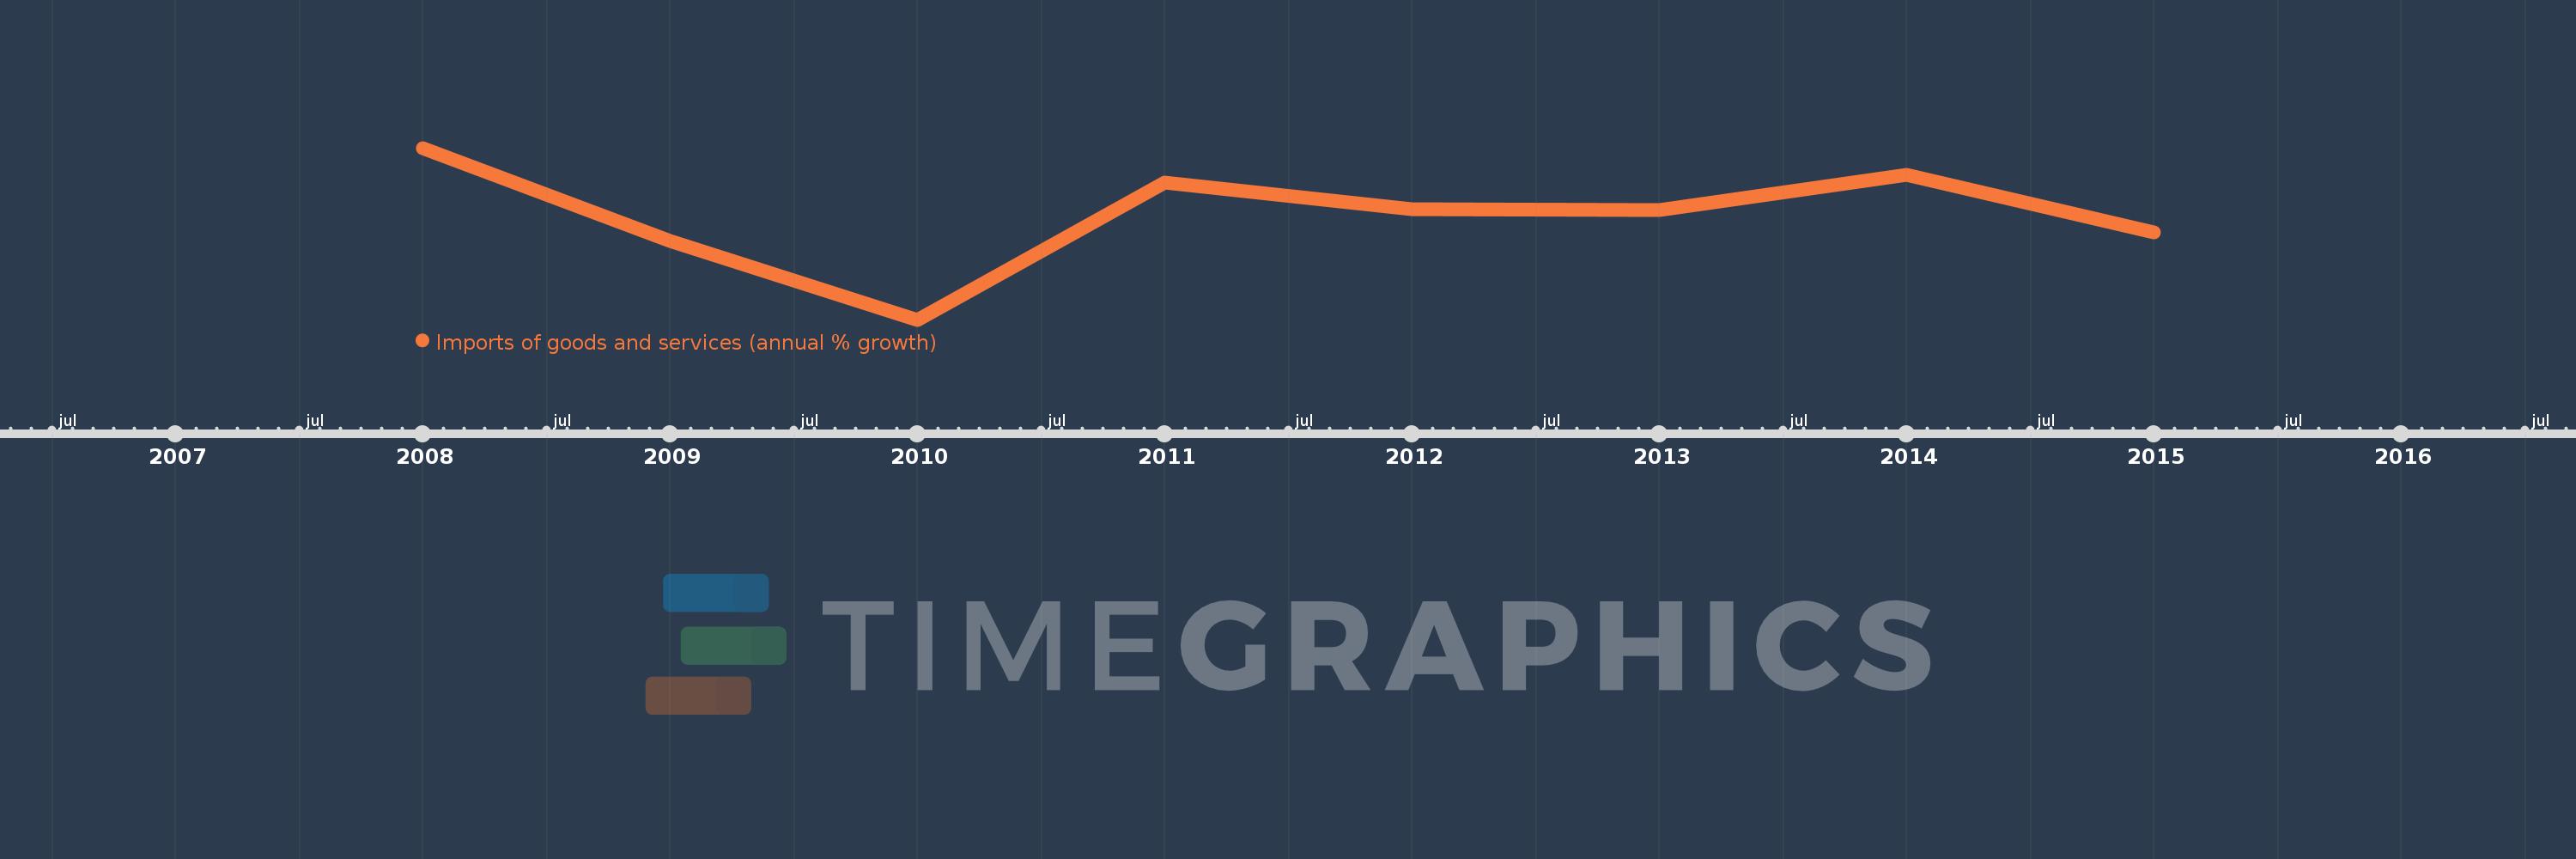
This timeline shows a graph from 2008 to 2015 of Least developed countries: UN classification. No data until 2007. Number of actual observations by date: 8.
Source name:
World Development Indicators
Source organization:
World Bank national accounts data, and OECD National Accounts data files.
Categories, topics:
Economy & Growth, Trade
Last updated:
apr 23, 2017
Indicators value changes by year
Meaning:
9.223
Minimum:
-2.059
jan 1, 2010
Maximum:
16.422
jan 1, 2008
At the date of observation
Value
Absolute change
Change from the previous value
jan 1, 2008
16.422
+16.422
0.0%
jan 1, 2009
6.374
-10.048
-61.18%
jan 1, 2010
-2.059
-8.433
-132.31%
jan 1, 2011
12.677
+14.736
-715.56%
jan 1, 2012
9.858
-2.818
-22.23%
jan 1, 2013
9.726
-0.132
-1.34%
jan 1, 2014
13.488
+3.762
38.68%
jan 1, 2015
7.298
-6.19
-45.89%
Ranking of countries by current statistics by years