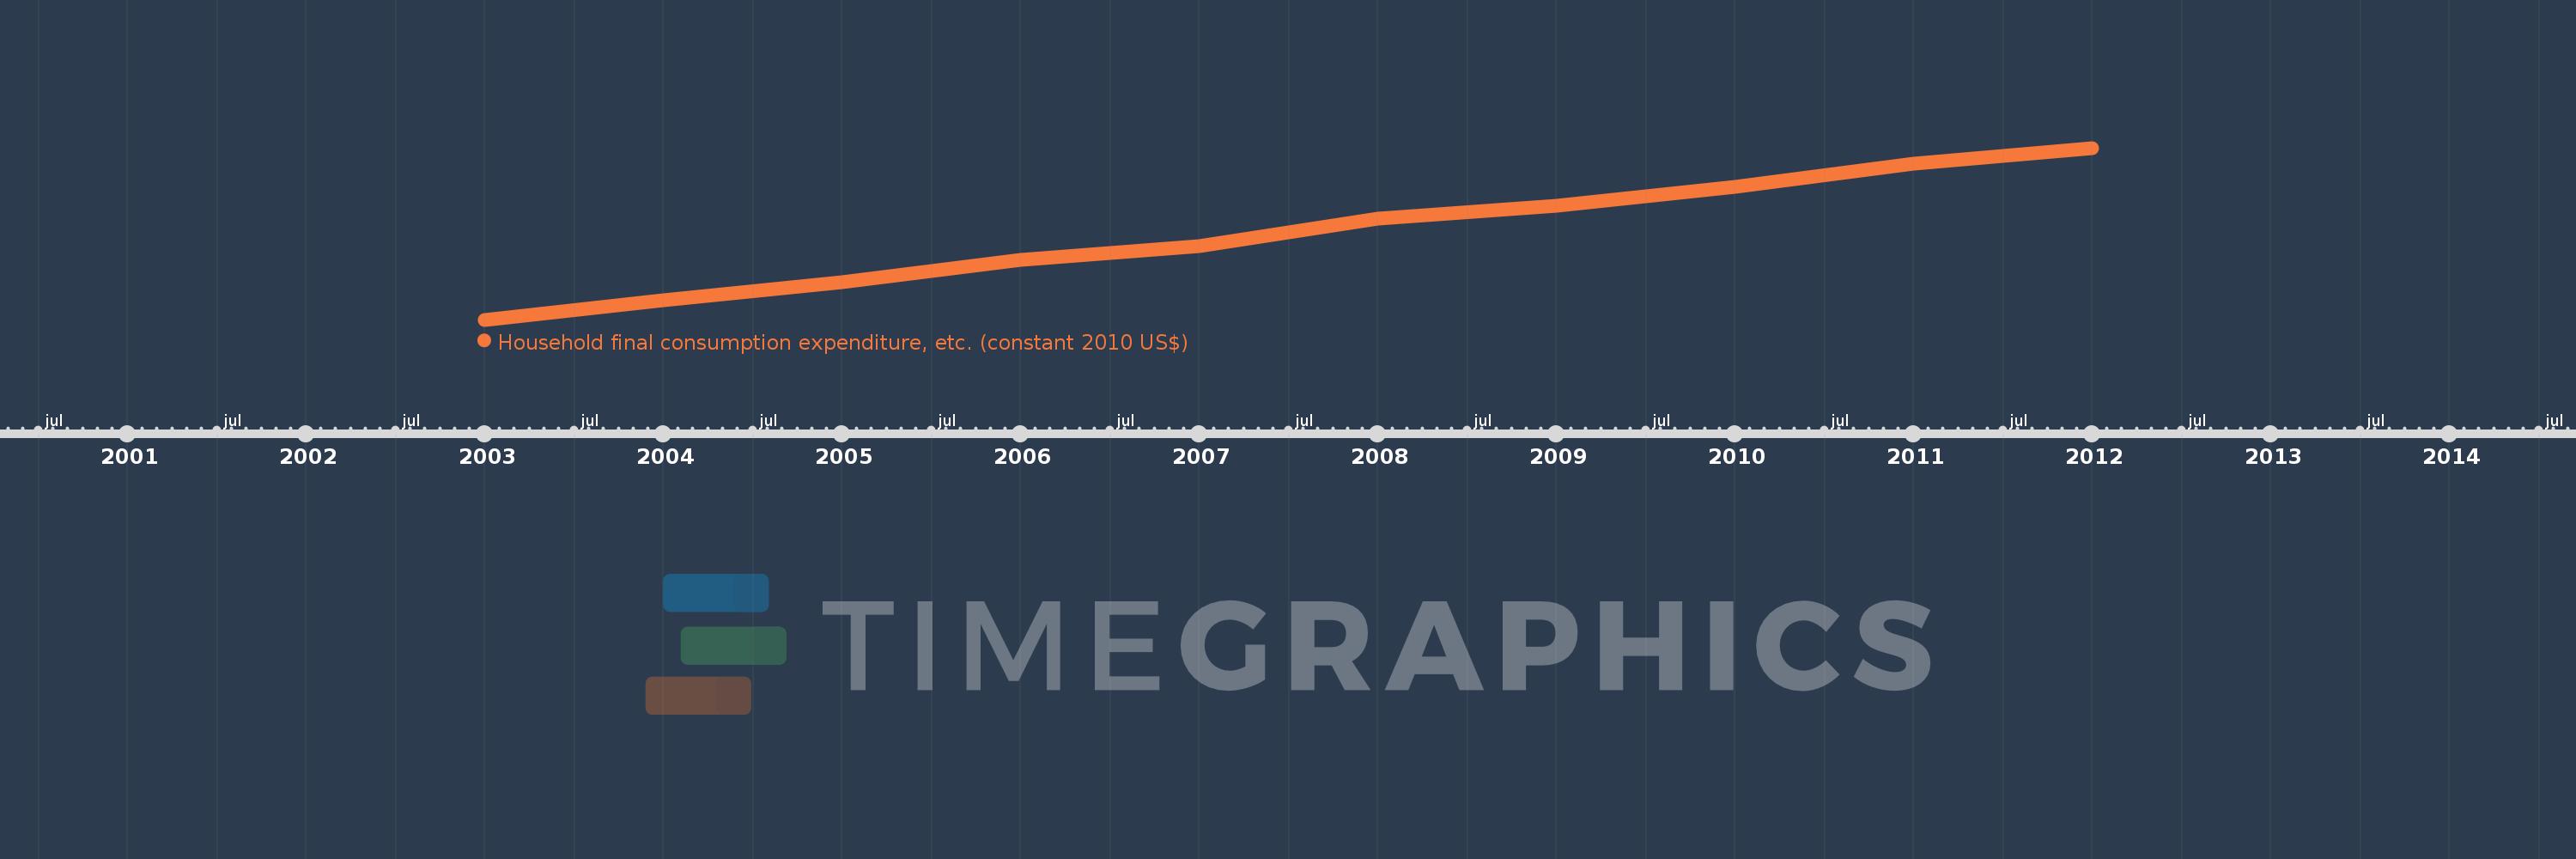
This timeline shows a graph from 2003 to 2012 of Least developed countries: UN classification. No data until 2002. Number of actual observations by date: 10.
Source name:
World Development Indicators
Source organization:
World Bank national accounts data, and OECD National Accounts data files.
Categories, topics:
Economy & Growth
Last updated:
apr 23, 2017
Indicators value changes by year
Meaning:
405.182 bln
Minimum:
322.417 bln
jan 1, 2003
Maximum:
486.679 bln
jan 1, 2012
At the date of observation
Value
Absolute change
Change from the previous value
jan 1, 2003
322.417 bln
+322.417 bln
0.0%
jan 1, 2004
340.677 bln
+18.26 bln
5.66%
jan 1, 2005
358.239 bln
+17.562 bln
5.16%
jan 1, 2006
379.714 bln
+21.475 bln
5.99%
jan 1, 2007
392.598 bln
+12.884 bln
3.39%
jan 1, 2008
418.851 bln
+26.254 bln
6.69%
jan 1, 2009
431.787 bln
+12.936 bln
3.09%
jan 1, 2010
449.203 bln
+17.417 bln
4.03%
jan 1, 2011
471.652 bln
+22.448 bln
5.0%
jan 1, 2012
486.679 bln
+15.027 bln
3.19%
Ranking of countries by current statistics by years