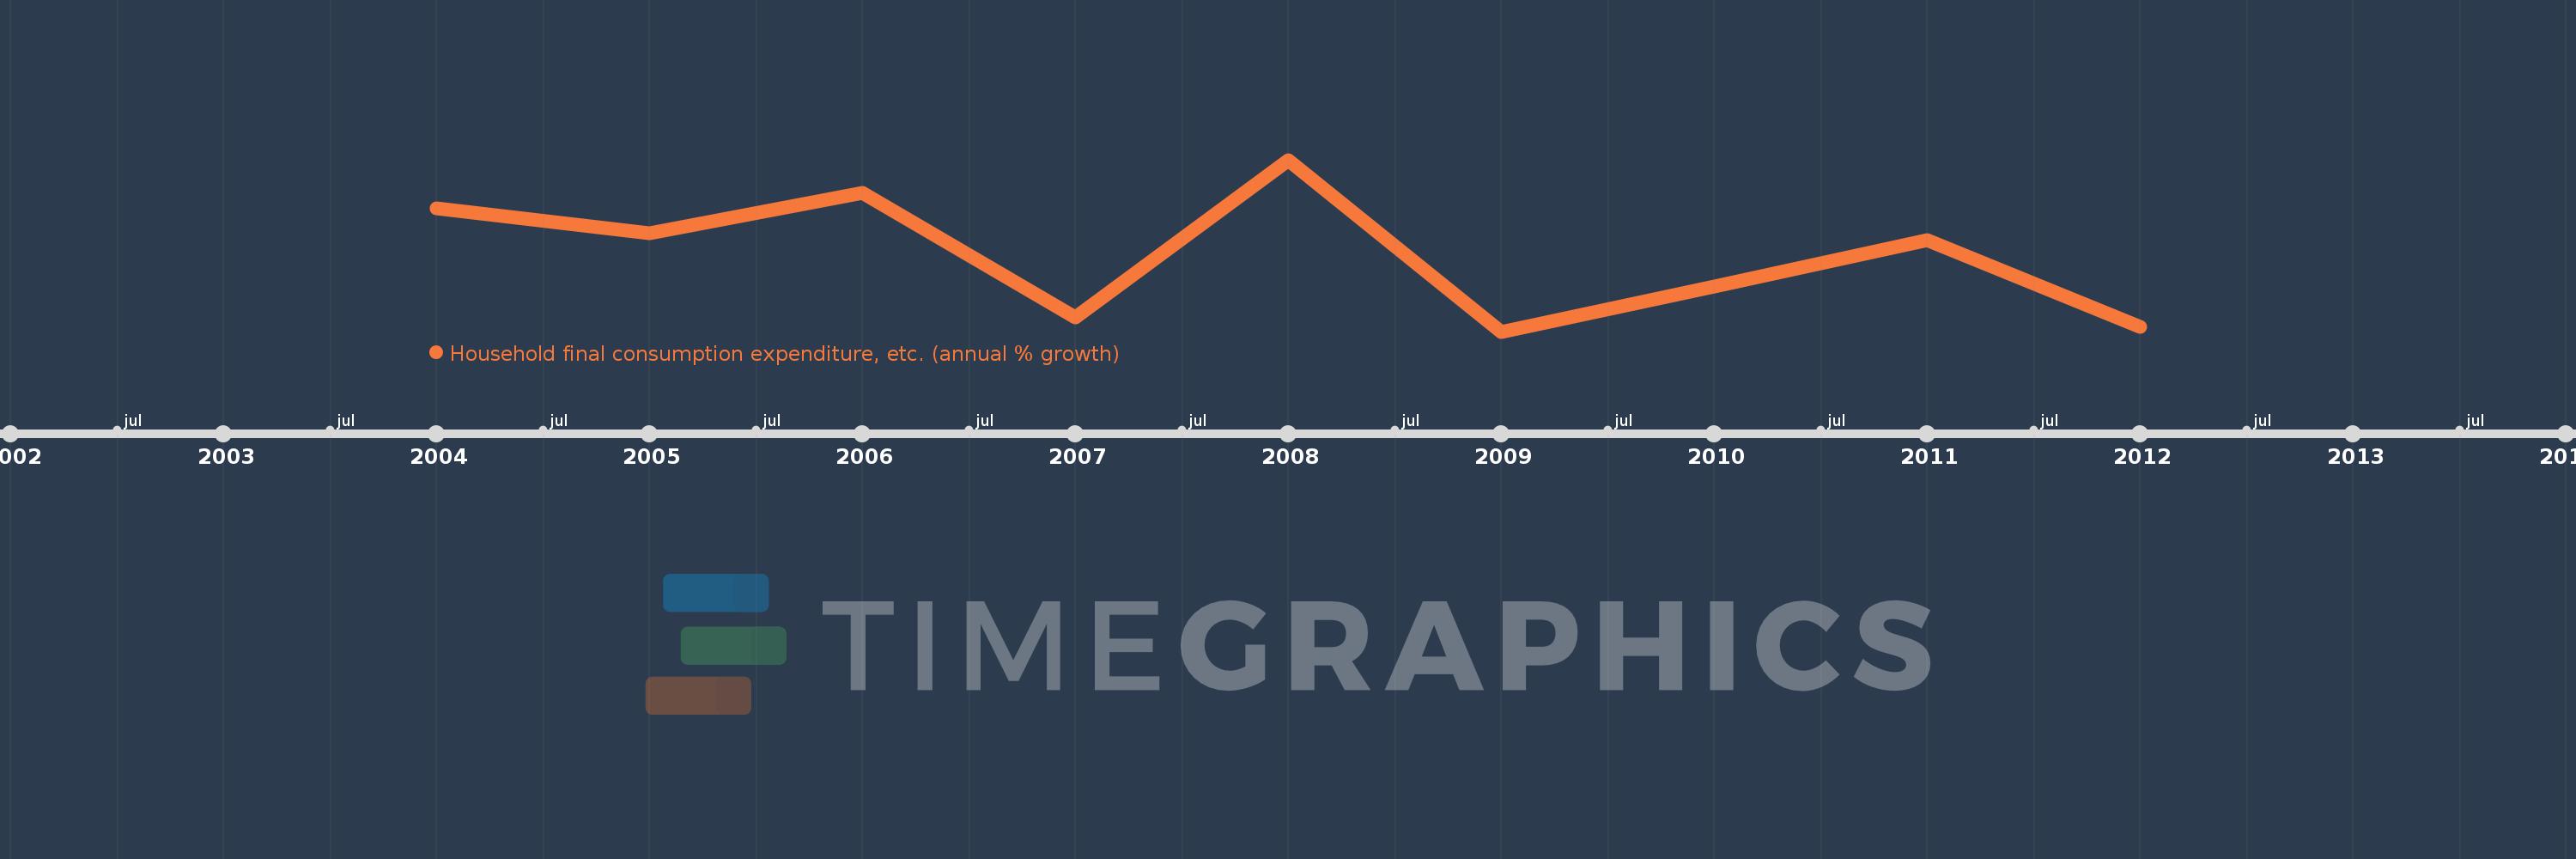
This timeline shows a graph from 2004 to 2012 of Least developed countries: UN classification. No data until 2003. Number of actual observations by date: 9.
Source name:
World Development Indicators
Source organization:
World Bank national accounts data, and OECD National Accounts data files.
Categories, topics:
Economy & Growth
Last updated:
apr 23, 2017
Indicators value changes by year
Meaning:
4.689
Minimum:
3.088
jan 1, 2009
Maximum:
6.687
jan 1, 2008
At the date of observation
Value
Absolute change
Change from the previous value
jan 1, 2004
5.663
+5.663
0.0%
jan 1, 2005
5.155
-0.508
-8.97%
jan 1, 2006
5.995
+0.839
16.28%
jan 1, 2007
3.393
-2.602
-43.4%
jan 1, 2008
6.687
+3.294
97.09%
jan 1, 2009
3.088
-3.599
-53.82%
jan 1, 2010
4.034
+0.945
30.61%
jan 1, 2011
4.997
+0.964
23.89%
jan 1, 2012
3.186
-1.811
-36.25%
Ranking of countries by current statistics by years