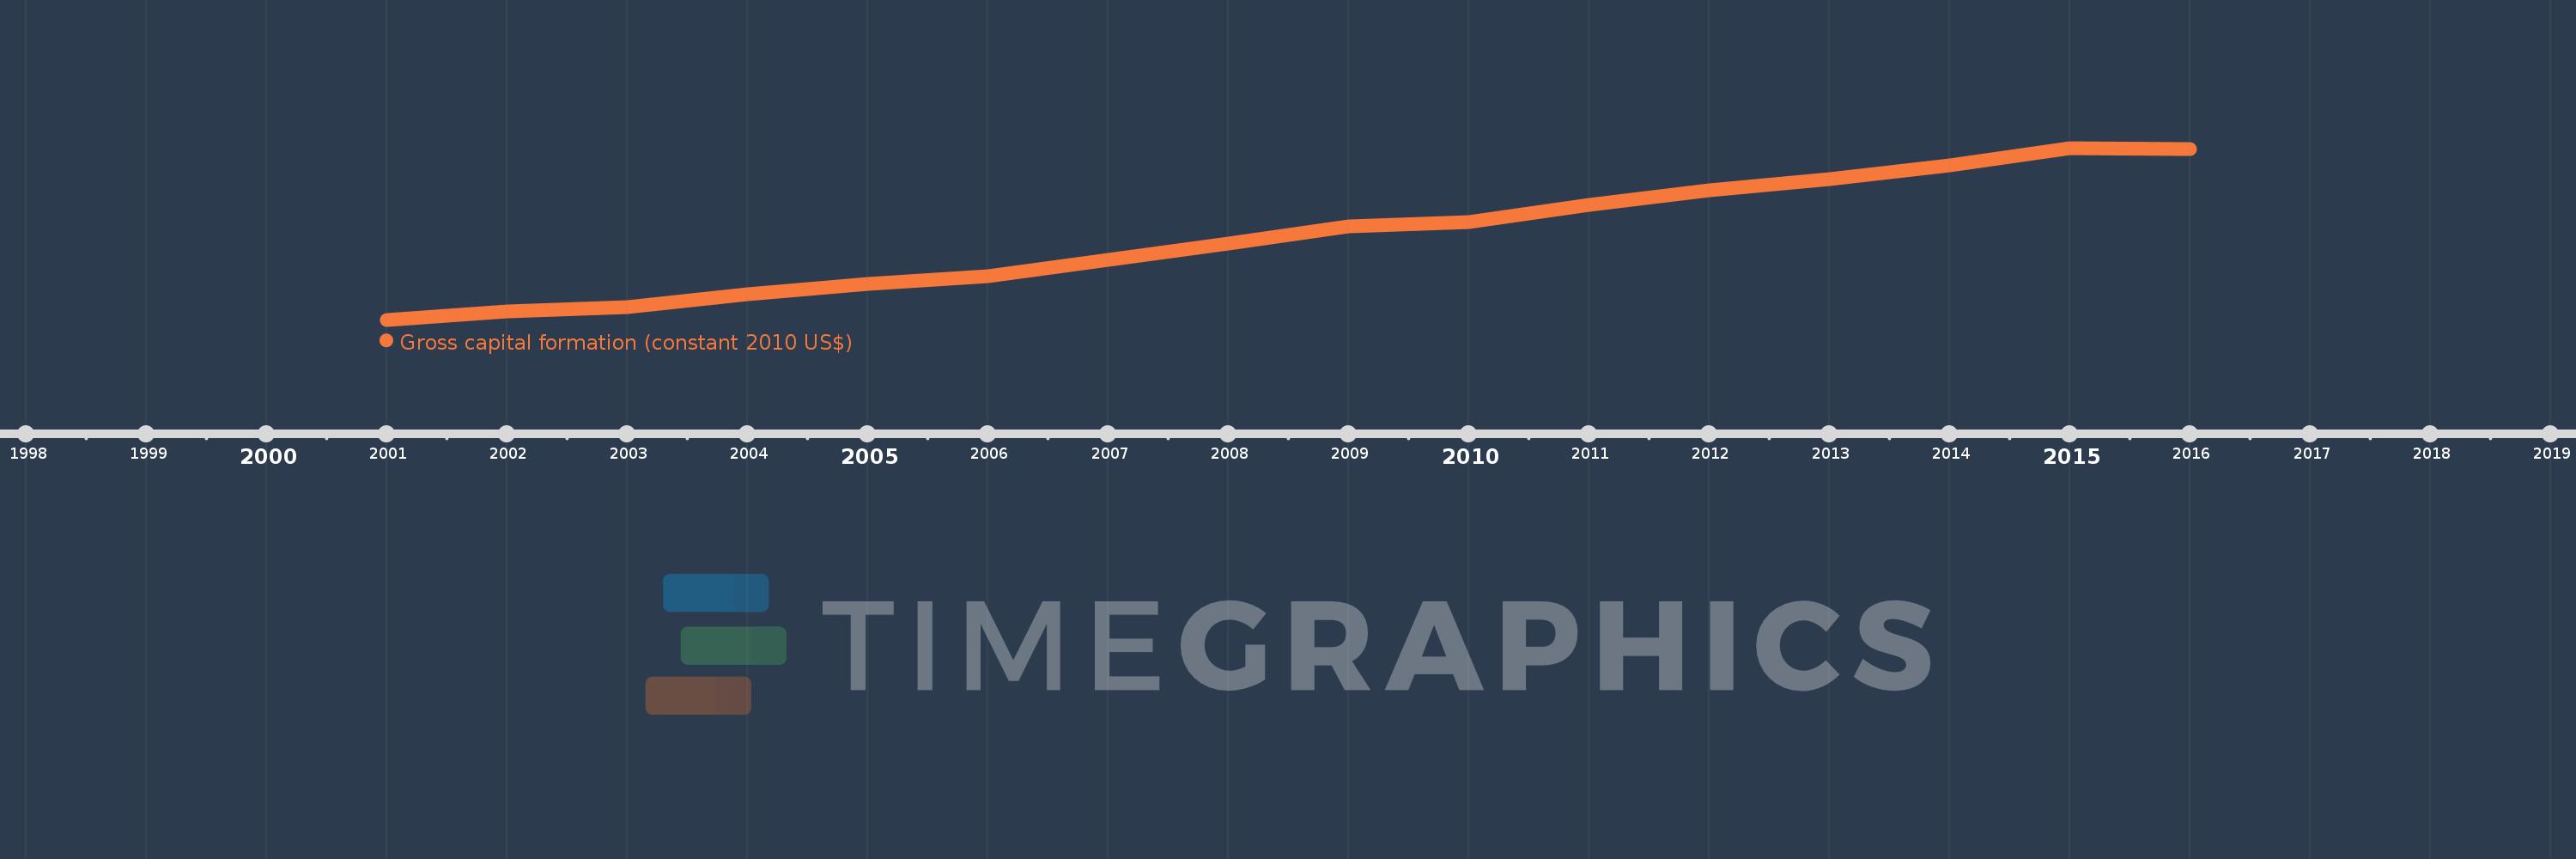
This timeline shows a graph from 2001 to 2016 of Least developed countries: UN classification. No data until 2000. Number of actual observations by date: 16.
Source name:
World Development Indicators
Source organization:
World Bank national accounts data, and OECD National Accounts data files.
Categories, topics:
Economy & Growth
Last updated:
apr 23, 2017
Indicators value changes by year
Meaning:
132.141 bln
Minimum:
66.281 bln
jan 1, 2001
Maximum:
201.907 bln
jan 1, 2015
At the date of observation
Value
Absolute change
Change from the previous value
jan 1, 2001
66.281 bln
+66.281 bln
0.0%
jan 1, 2002
72.721 bln
+6.44 bln
9.72%
jan 1, 2003
75.932 bln
+3.211 bln
4.42%
jan 1, 2004
86.56 bln
+10.628 bln
14.0%
jan 1, 2005
94.503 bln
+7.943 bln
9.18%
jan 1, 2006
100.972 bln
+6.47 bln
6.85%
jan 1, 2007
113.569 bln
+12.597 bln
12.48%
jan 1, 2008
126.358 bln
+12.788 bln
11.26%
jan 1, 2009
139.824 bln
+13.467 bln
10.66%
jan 1, 2010
143.515 bln
+3.69 bln
2.64%
jan 1, 2011
157.256 bln
+13.742 bln
9.58%
jan 1, 2012
168.319 bln
+11.063 bln
7.03%
jan 1, 2013
177.501 bln
+9.183 bln
5.46%
jan 1, 2014
187.936 bln
+10.435 bln
5.88%
jan 1, 2015
201.907 bln
+13.971 bln
7.43%
jan 1, 2016
201.11 bln
-797.536 mln
-0.4%
Ranking of countries by current statistics by years