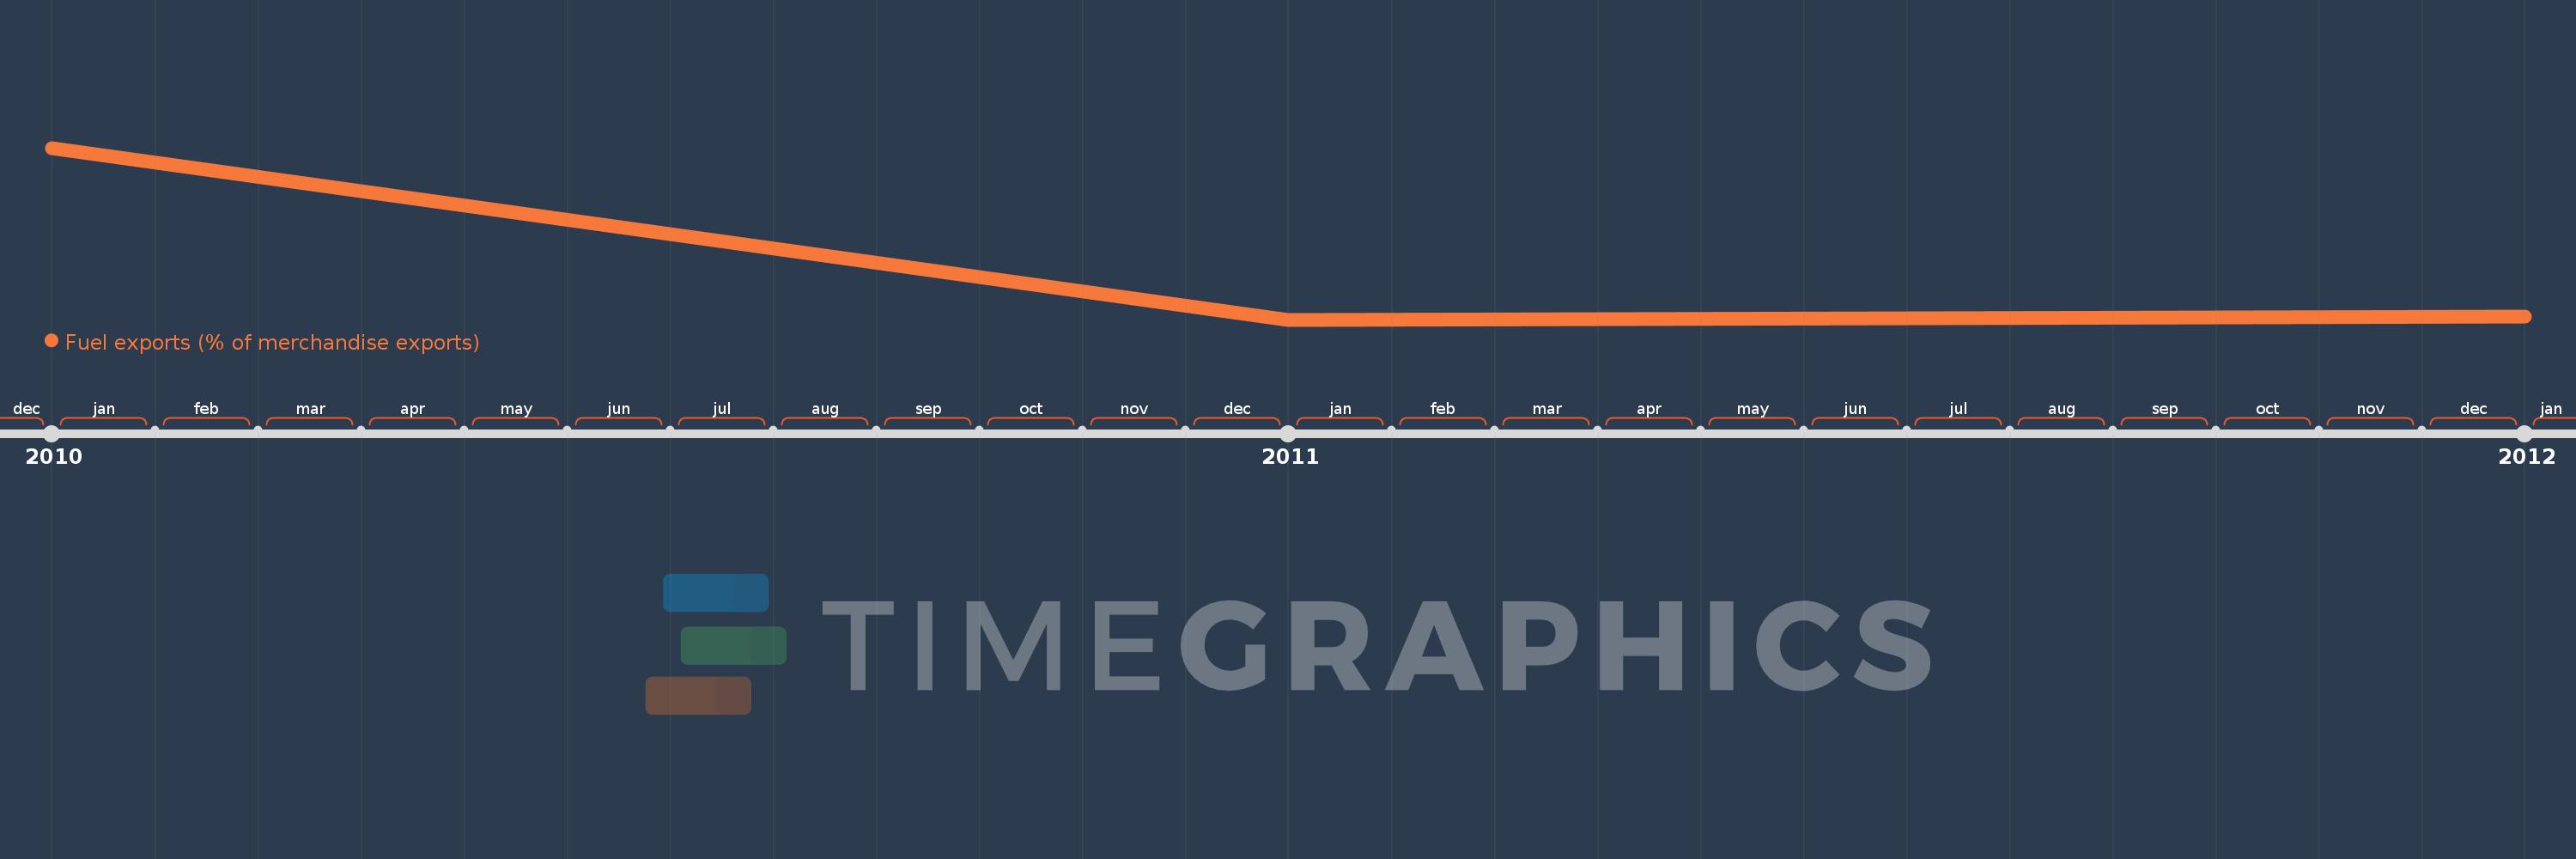
This timeline shows a graph from 2010 to 2012 of Least developed countries: UN classification. No data until 2009. Number of actual observations by date: 3.
Source name:
World Development Indicators
Source organization:
World Bank staff estimates from the Comtrade database maintained by the United Nations Statistics Division.
Categories, topics:
Energy & Mining, Private Sector, Trade
Last updated:
apr 23, 2017
Indicators value changes by year
Meaning:
54.06
Minimum:
52.391
jan 1, 2011
Maximum:
57.315
jan 1, 2010
At the date of observation
Value
Absolute change
Change from the previous value
jan 1, 2010
57.315
+57.315
0.0%
jan 1, 2011
52.391
-4.925
-8.59%
jan 1, 2012
52.474
+0.084
0.16%
Ranking of countries by current statistics by years