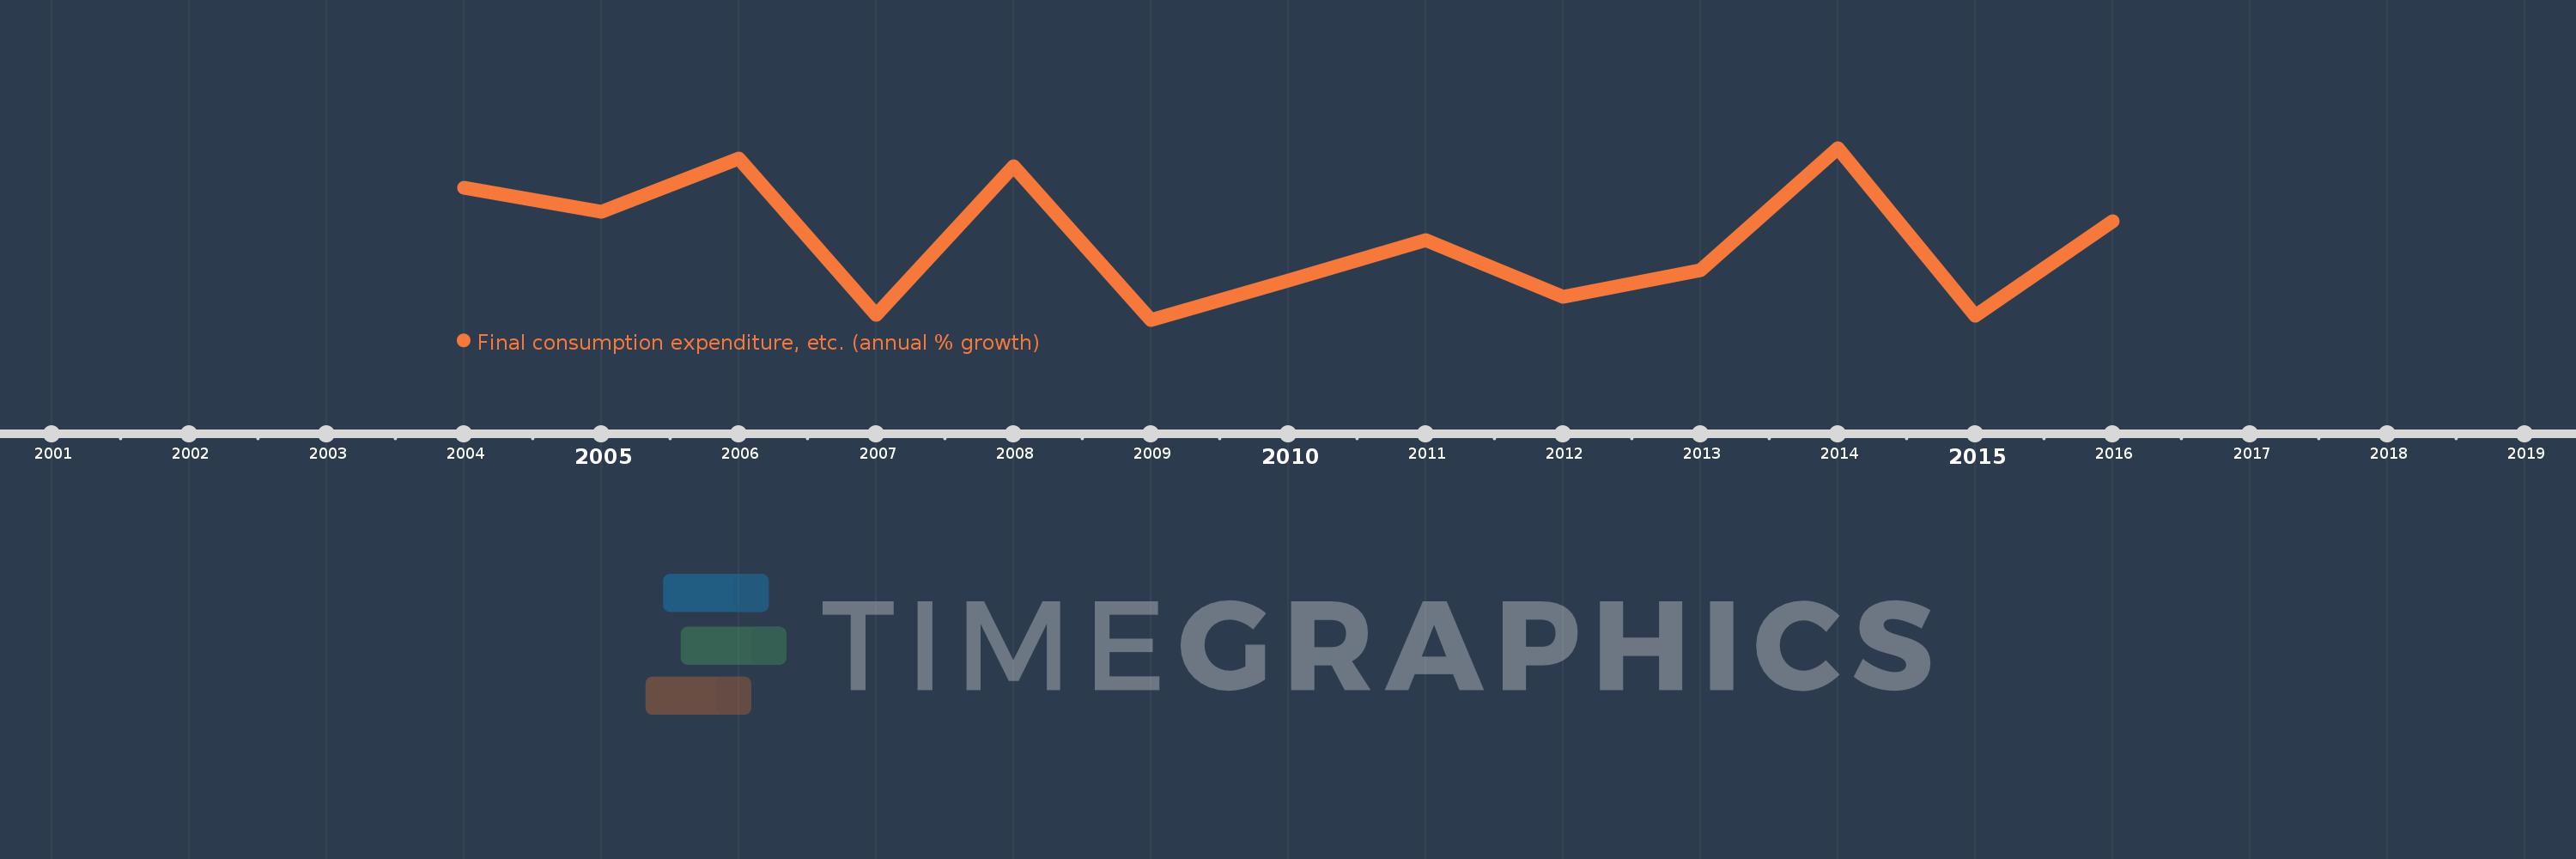
This timeline shows a graph from 2004 to 2016 of Least developed countries: UN classification. No data until 2003. Number of actual observations by date: 13.
Source name:
World Development Indicators
Source organization:
World Bank national accounts data, and OECD National Accounts data files.
Categories, topics:
Economy & Growth
Last updated:
apr 23, 2017
Indicators value changes by year
Meaning:
5.157
Minimum:
3.551
jan 1, 2009
Maximum:
7.043
jan 1, 2014
At the date of observation
Value
Absolute change
Change from the previous value
jan 1, 2004
6.243
+6.243
0.0%
jan 1, 2005
5.744
-0.499
-7.99%
jan 1, 2006
6.827
+1.083
18.86%
jan 1, 2007
3.659
-3.168
-46.4%
jan 1, 2008
6.676
+3.017
82.44%
jan 1, 2009
3.551
-3.125
-46.81%
jan 1, 2010
4.349
+0.798
22.47%
jan 1, 2011
5.173
+0.824
18.94%
jan 1, 2012
4.023
-1.15
-22.24%
jan 1, 2013
4.559
+0.537
13.34%
jan 1, 2014
7.043
+2.483
54.47%
jan 1, 2015
3.638
-3.404
-48.34%
jan 1, 2016
5.551
+1.912
52.55%
Ranking of countries by current statistics by years