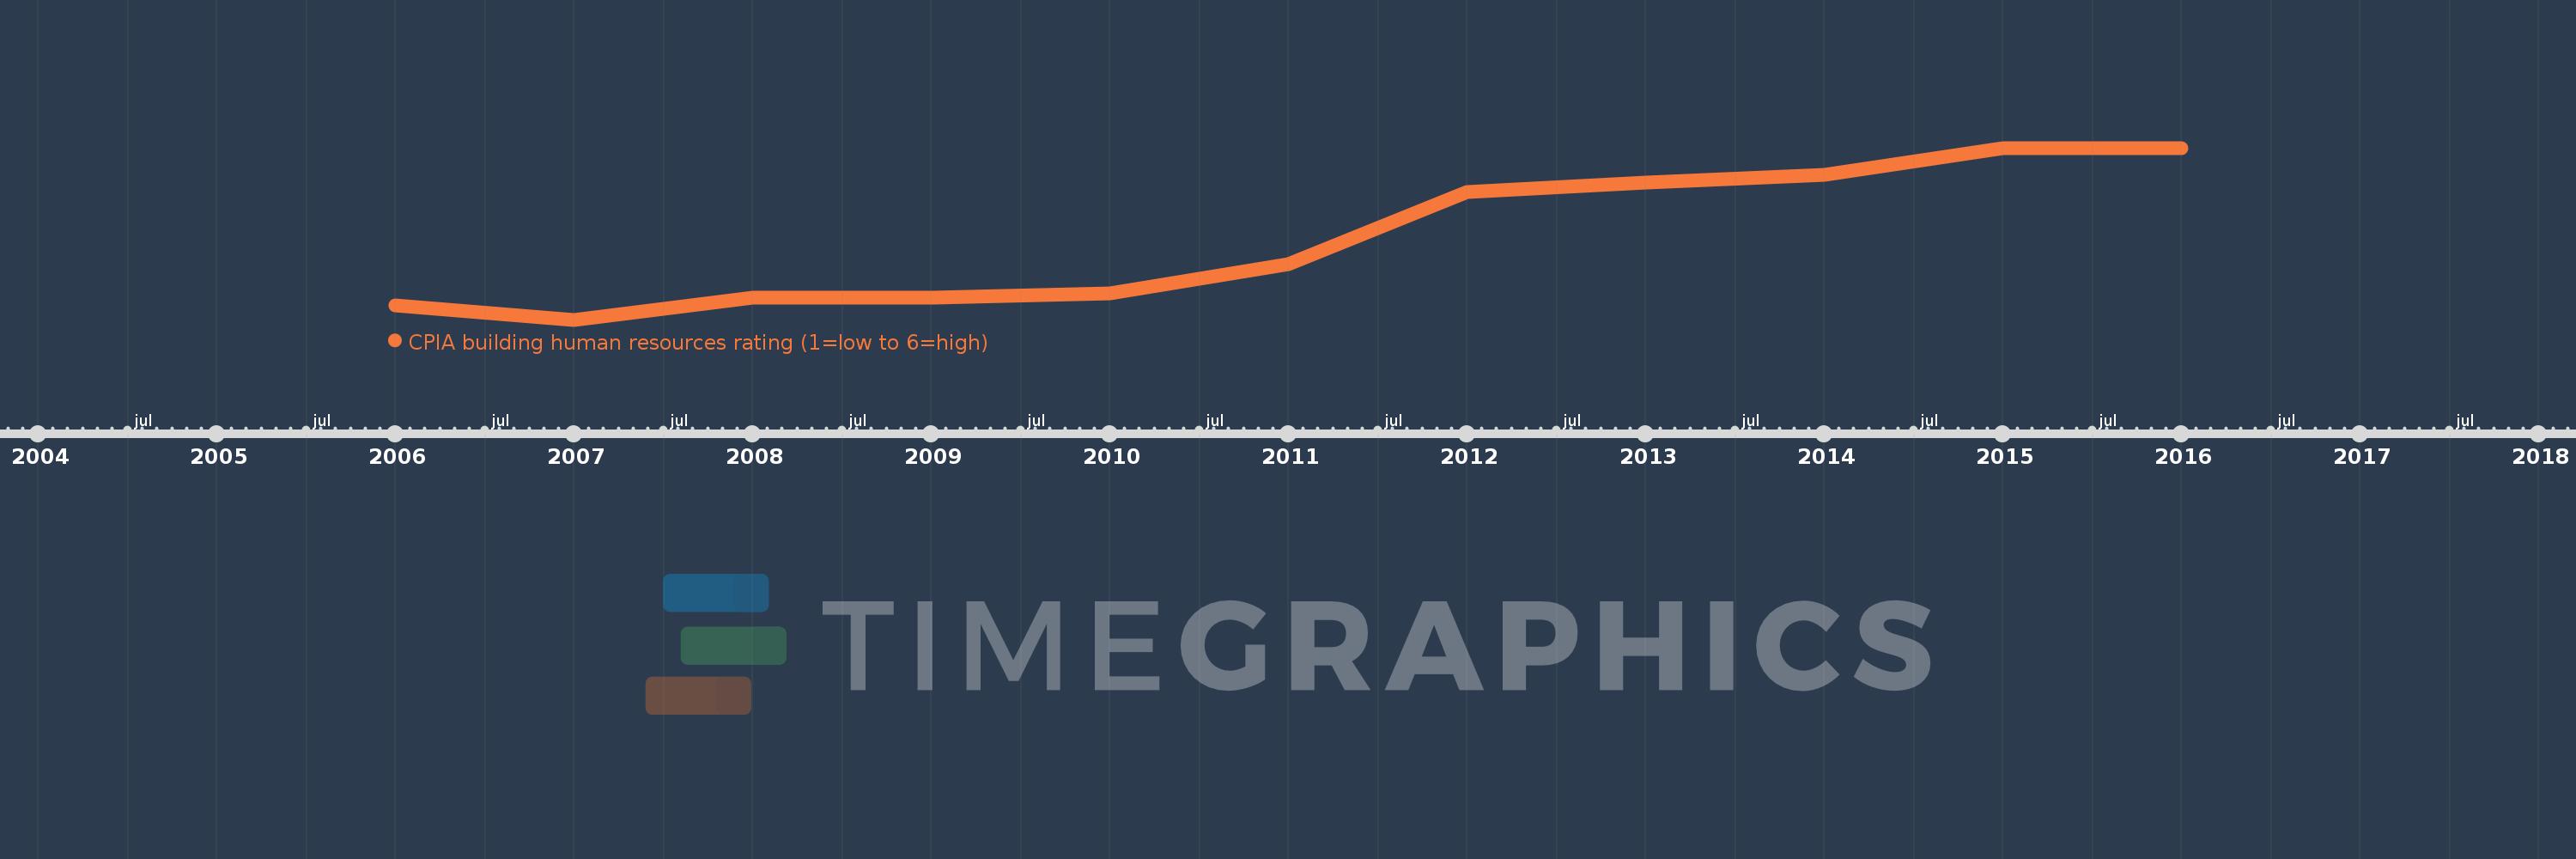
This timeline shows a graph from 2006 to 2016 of Least developed countries: UN classification. No data until 2005. Number of actual observations by date: 11.
Source name:
World Development Indicators
Source organization:
World Bank Group, CPIA database (http://www.worldbank.org/ida).
Categories, topics:
Public Sector
Last updated:
apr 23, 2017
Indicators value changes by year
Meaning:
3.333
Minimum:
3.202
jan 1, 2007
Maximum:
3.478
jan 1, 2015
At the date of observation
Value
Absolute change
Change from the previous value
jan 1, 2006
3.225
+3.225
0.0%
jan 1, 2007
3.202
-0.023
-0.7%
jan 1, 2008
3.238
+0.036
1.12%
jan 1, 2009
3.238
0.0
0.0%
jan 1, 2010
3.244
+0.006
0.19%
jan 1, 2011
3.291
+0.047
1.43%
jan 1, 2012
3.407
+0.116
3.53%
jan 1, 2013
3.422
+0.015
0.45%
jan 1, 2014
3.435
+0.013
0.37%
jan 1, 2015
3.478
+0.043
1.25%
jan 1, 2016
3.478
0.0
0.0%
Ranking of countries by current statistics by years