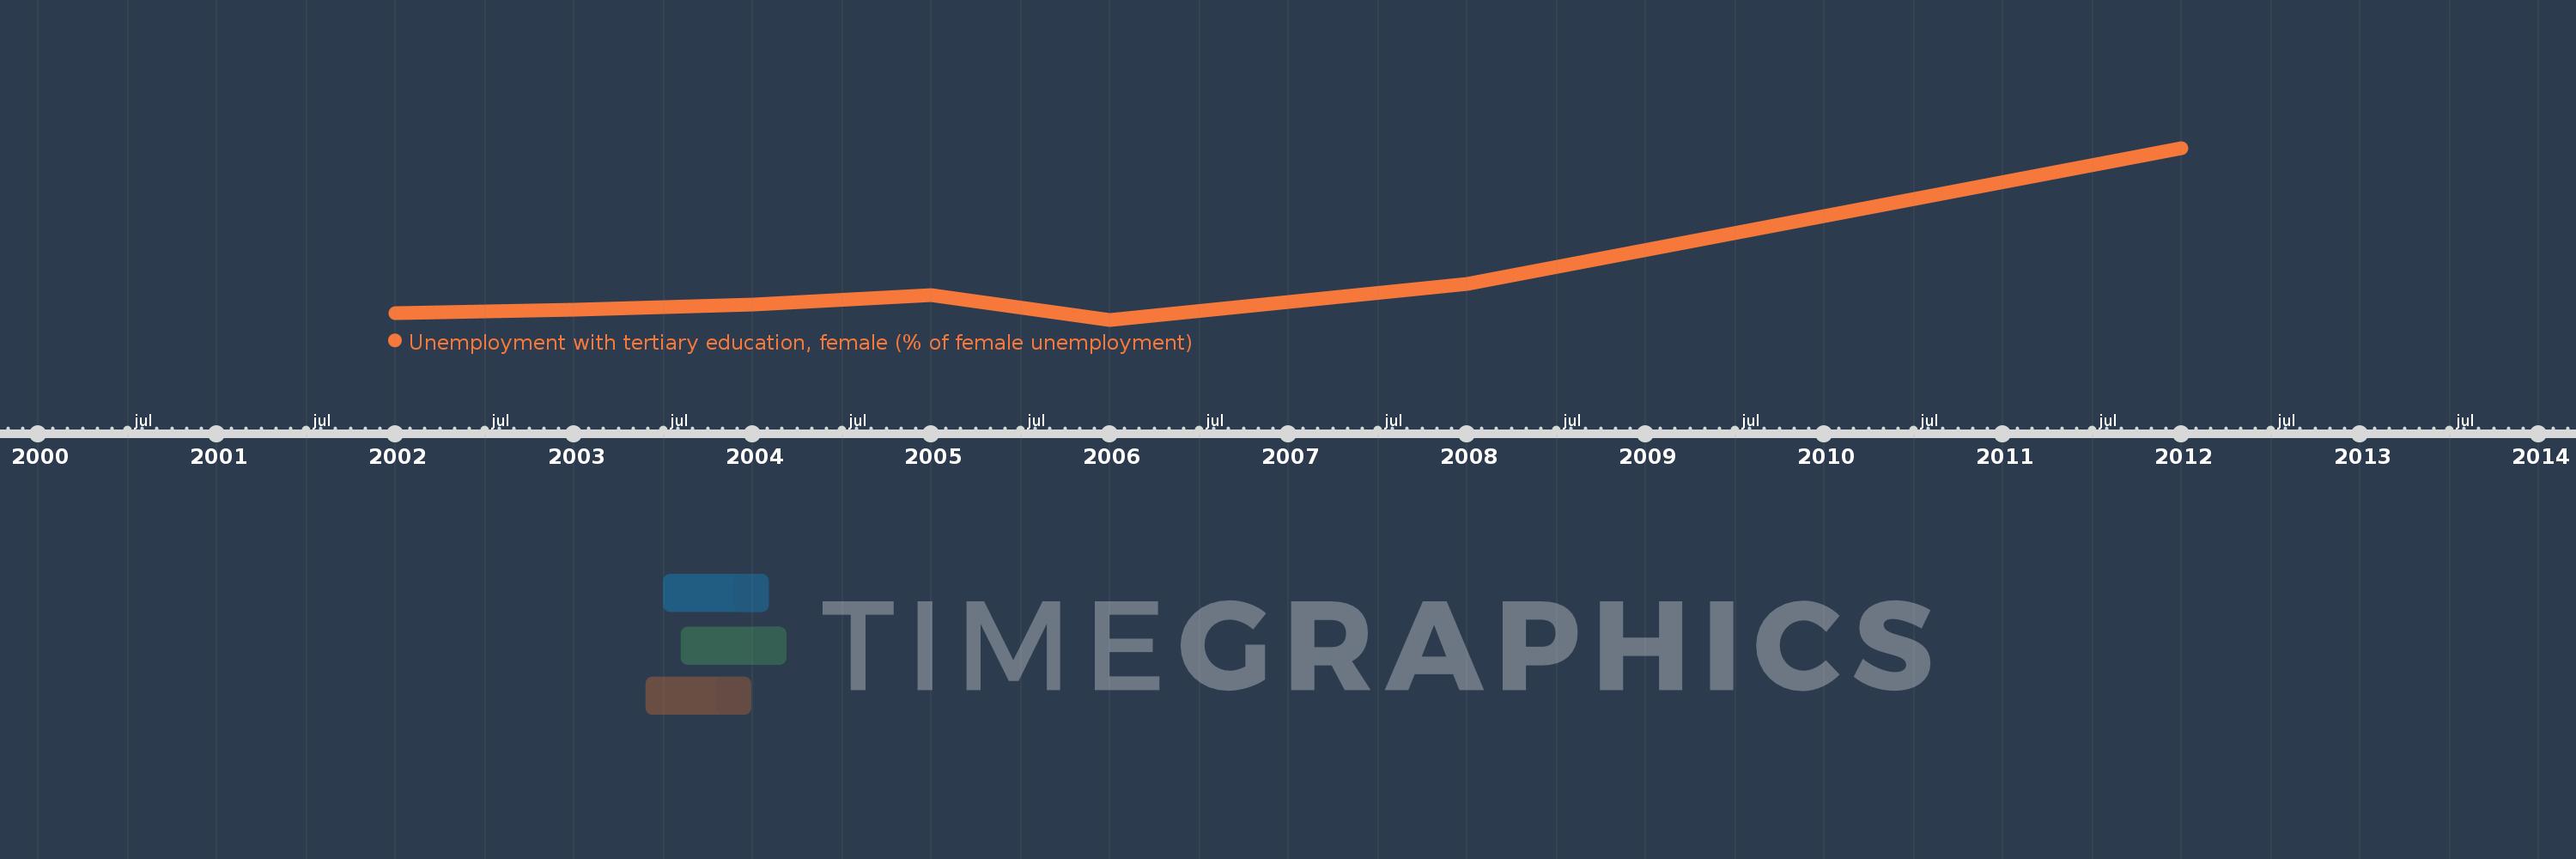
This timeline shows a graph from 2002 to 2012 of Latin America & the Caribbean (IDA & IBRD countries). No data until 2001. Number of actual observations by date: 8.
Source name:
World Development Indicators
Source organization:
International Labour Organization, Key Indicators of the Labour Market database.
Categories, topics:
Social Protection & Labor, Gender
Last updated:
apr 23, 2017
Indicators value changes by year
Meaning:
13.126
Minimum:
11.078
jan 1, 2006
Maximum:
21.022
jan 1, 2012
At the date of observation
Value
Absolute change
Change from the previous value
jan 1, 2002
11.459
+11.459
0.0%
jan 1, 2003
11.677
+0.217
1.9%
jan 1, 2004
11.973
+0.296
2.54%
jan 1, 2005
12.526
+0.553
4.62%
jan 1, 2006
11.078
-1.448
-11.56%
jan 1, 2007
12.105
+1.026
9.26%
jan 1, 2008
13.17
+1.065
8.8%
jan 1, 2012
21.022
+7.852
59.62%
Ranking of countries by current statistics by years