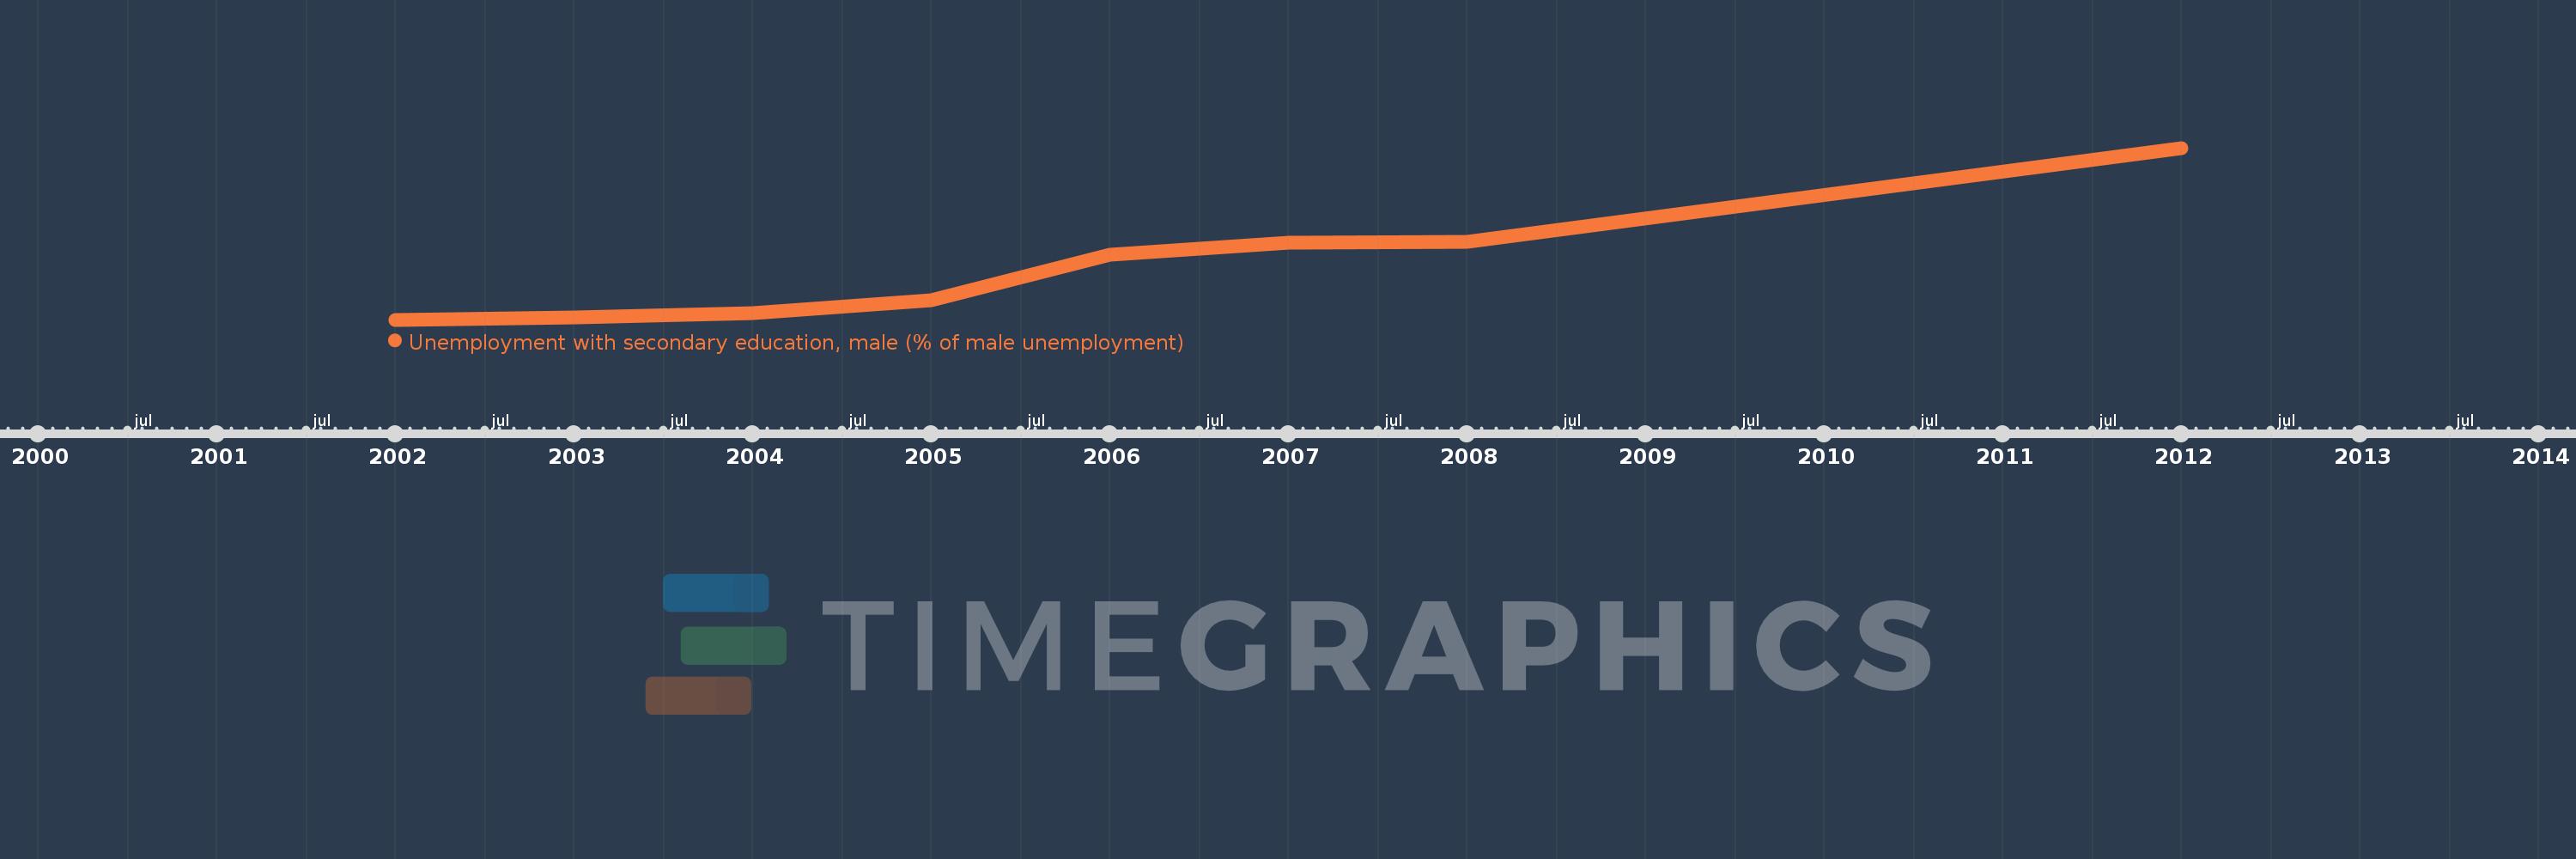
This timeline shows a graph from 2002 to 2012 of Latin America & the Caribbean (IDA & IBRD countries). No data until 2001. Number of actual observations by date: 8.
Source name:
World Development Indicators
Source organization:
International Labour Organization, Key Indicators of the Labour Market database.
Categories, topics:
Social Protection & Labor, Gender
Last updated:
apr 23, 2017
Indicators value changes by year
Meaning:
31.754
Minimum:
24.814
jan 1, 2002
Maximum:
47.553
jan 1, 2012
At the date of observation
Value
Absolute change
Change from the previous value
jan 1, 2002
24.814
+24.814
0.0%
jan 1, 2003
25.087
+0.273
1.1%
jan 1, 2004
25.663
+0.576
2.3%
jan 1, 2005
27.35
+1.686
6.57%
jan 1, 2006
33.409
+6.059
22.15%
jan 1, 2007
34.974
+1.565
4.68%
jan 1, 2008
35.181
+0.207
0.59%
jan 1, 2012
47.553
+12.372
35.17%
Ranking of countries by current statistics by years