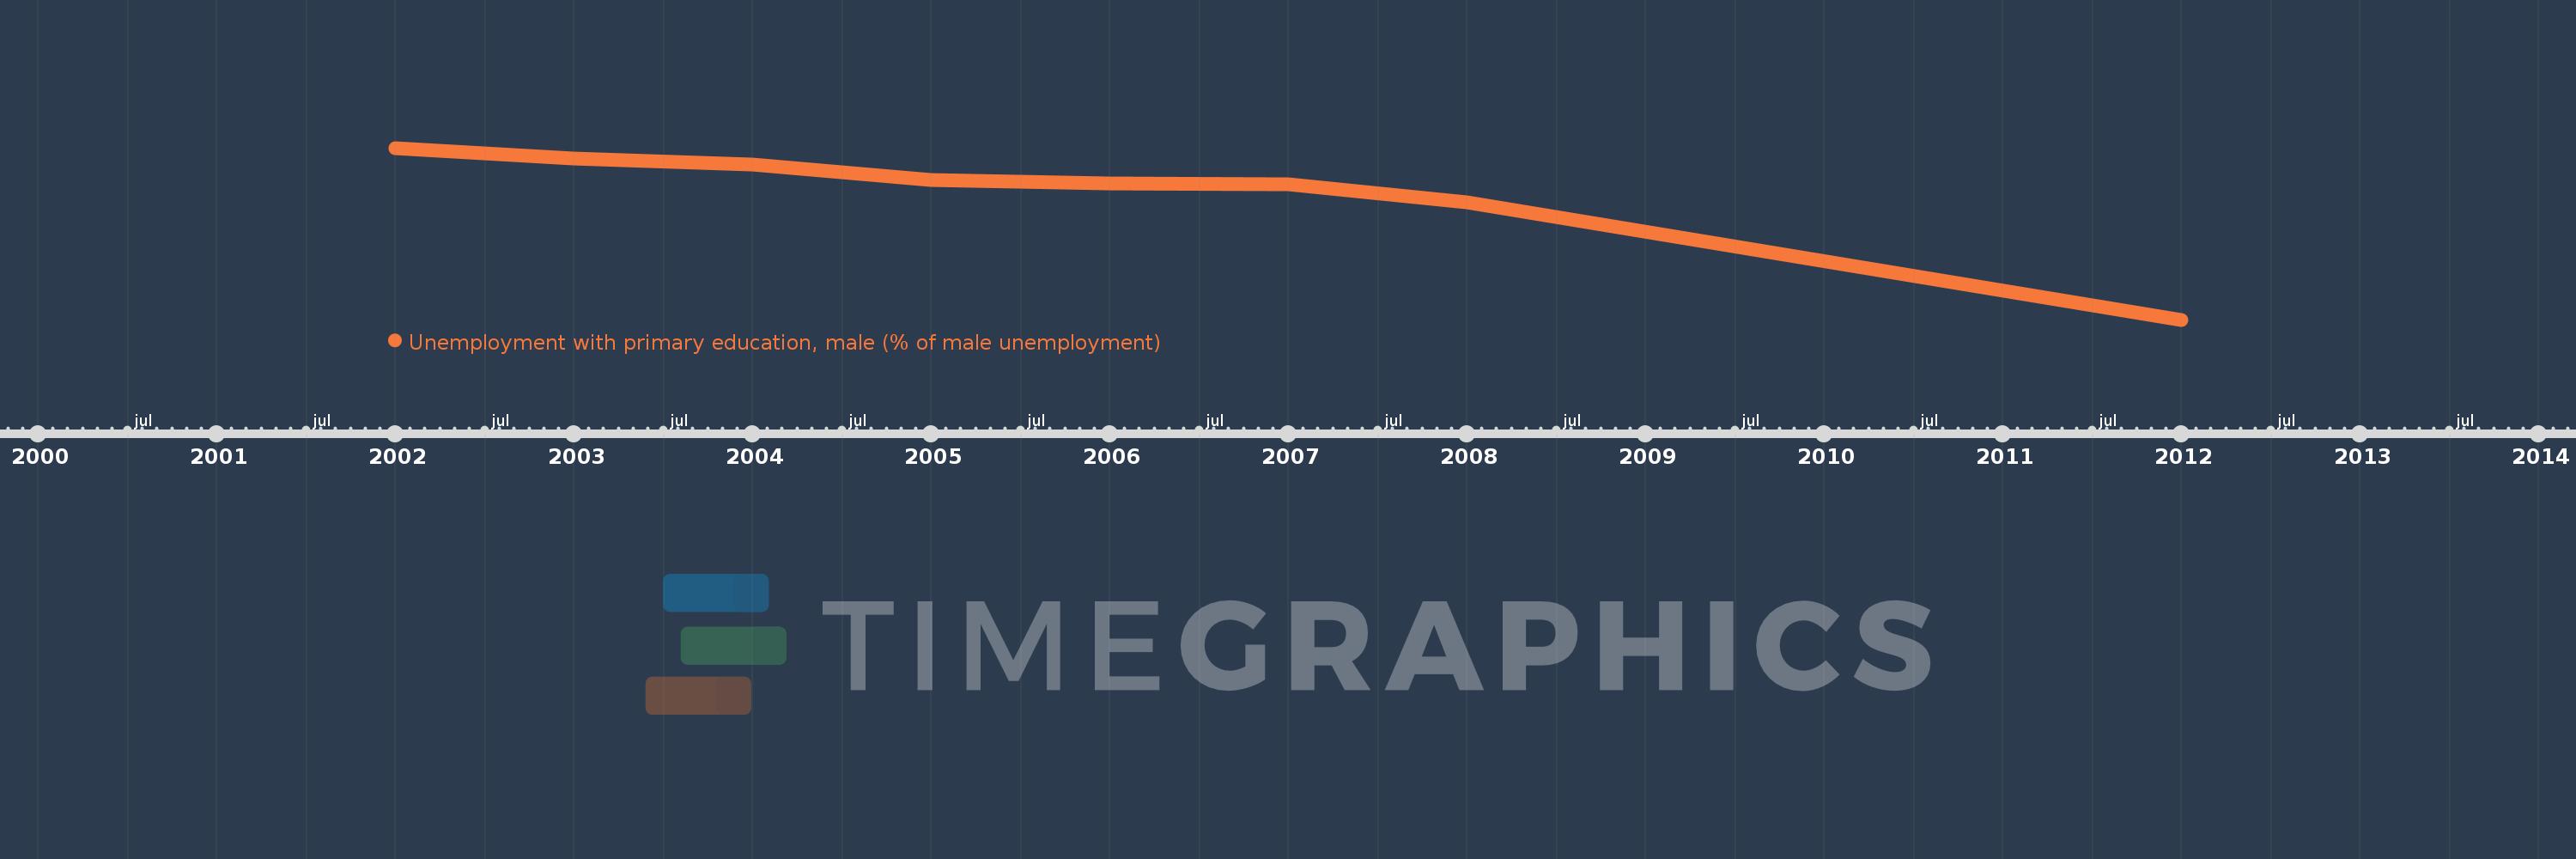
This timeline shows a graph from 2002 to 2012 of Latin America & the Caribbean (IDA & IBRD countries). No data until 2001. Number of actual observations by date: 8.
Source name:
World Development Indicators
Source organization:
International Labour Organization, Key Indicators of the Labour Market database.
Categories, topics:
Social Protection & Labor, Gender
Last updated:
apr 23, 2017
Indicators value changes by year
Meaning:
45.502
Minimum:
29.722
jan 1, 2012
Maximum:
51.028
jan 1, 2002
At the date of observation
Value
Absolute change
Change from the previous value
jan 1, 2002
51.028
+51.028
0.0%
jan 1, 2003
49.729
-1.299
-2.55%
jan 1, 2004
49.024
-0.705
-1.42%
jan 1, 2005
47.09
-1.933
-3.94%
jan 1, 2006
46.64
-0.45
-0.96%
jan 1, 2007
46.482
-0.158
-0.34%
jan 1, 2008
44.298
-2.184
-4.7%
jan 1, 2012
29.722
-14.576
-32.9%
Ranking of countries by current statistics by years