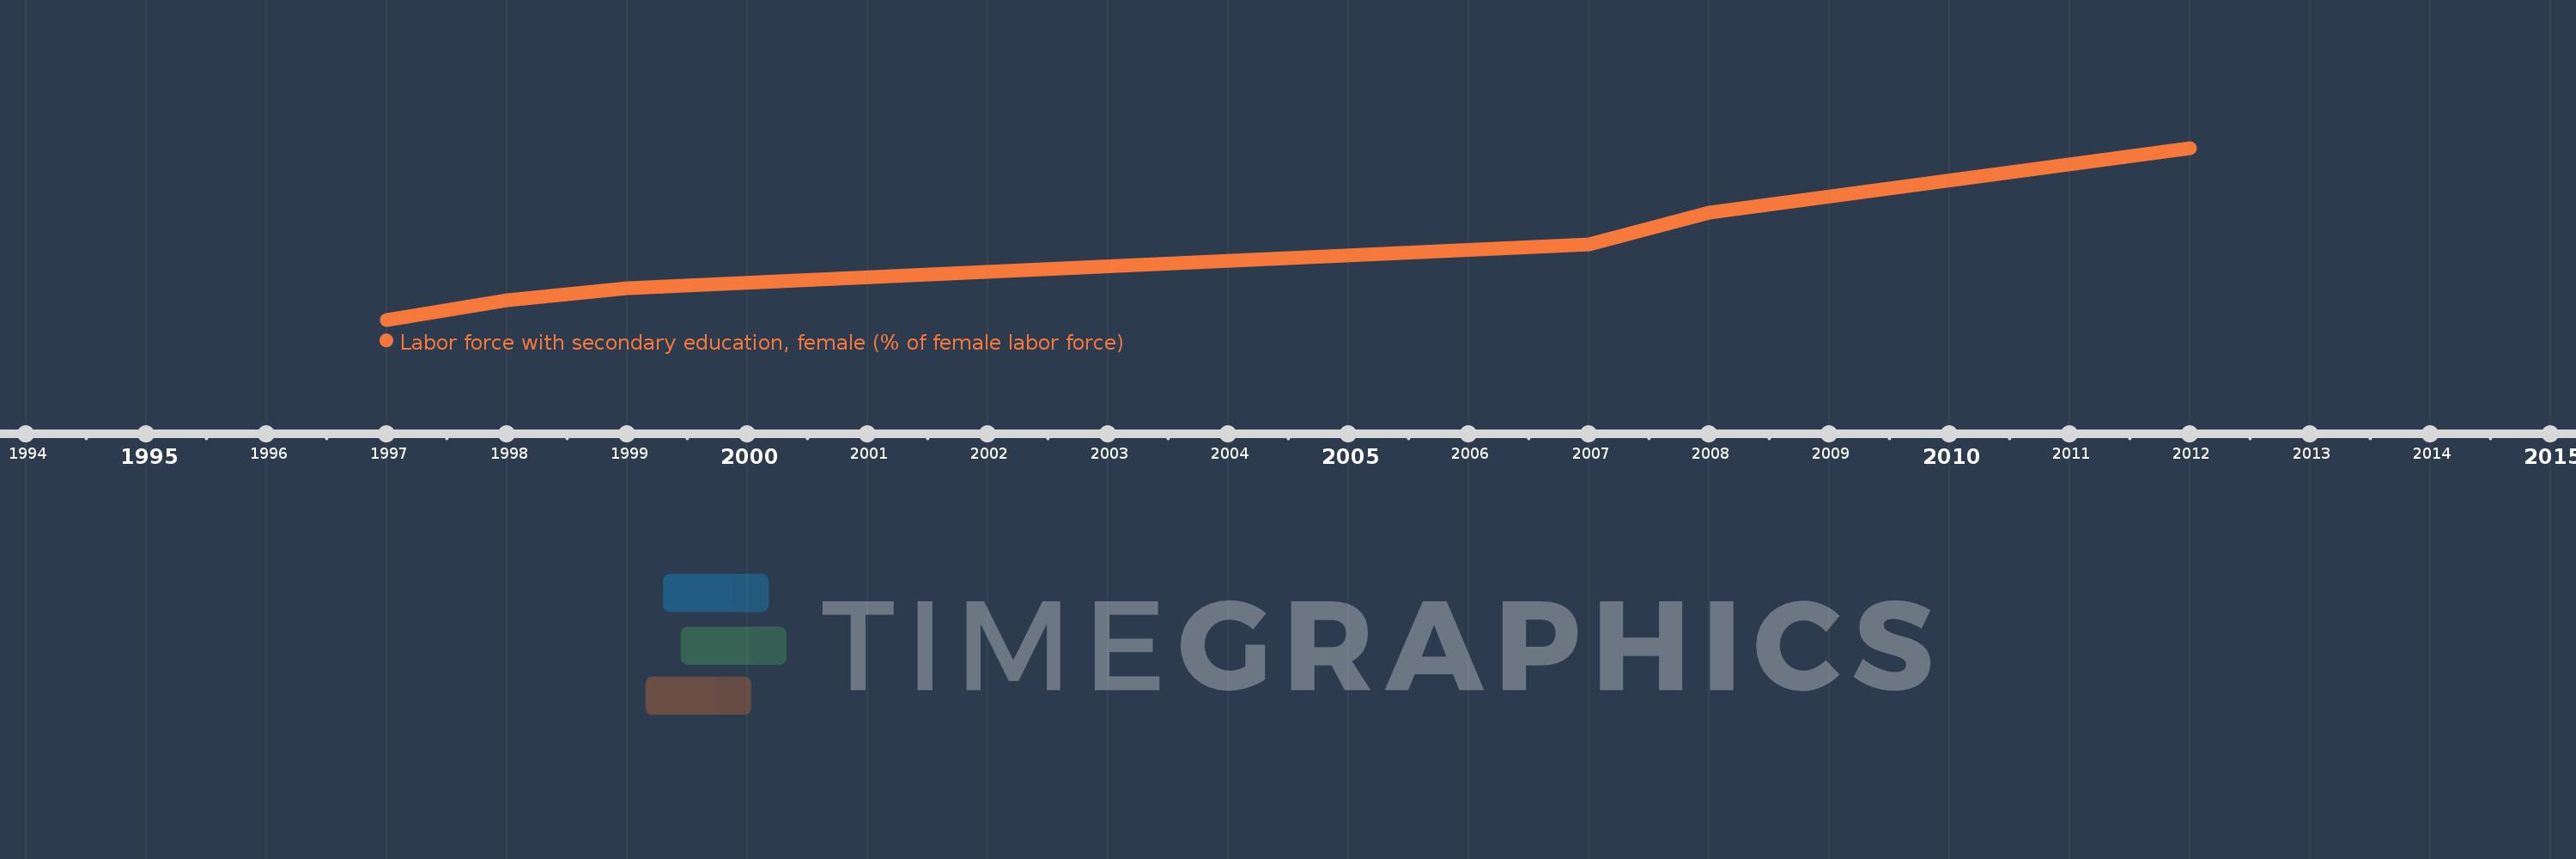
This timeline shows a graph from 1997 to 2012 of Latin America & the Caribbean (IDA & IBRD countries). No data until 1996. Number of actual observations by date: 6.
Source name:
World Development Indicators
Source organization:
International Labour Organization, Key Indicators of the Labour Market database.
Categories, topics:
Education, Social Protection & Labor, Gender
Last updated:
apr 23, 2017
Indicators value changes by year
Meaning:
30.463
Minimum:
24.084
jan 1, 1997
Maximum:
40.3
jan 1, 2012
At the date of observation
Value
Absolute change
Change from the previous value
jan 1, 1997
24.084
+24.084
0.0%
jan 1, 1998
25.887
+1.803
7.49%
jan 1, 1999
27.099
+1.212
4.68%
jan 1, 2007
31.183
+4.084
15.07%
jan 1, 2008
34.223
+3.04
9.75%
jan 1, 2012
40.3
+6.077
17.76%
Ranking of countries by current statistics by years