29
/
en
AIzaSyAYiBZKx7MnpbEhh9jyipgxe19OcubqV5w
April 1, 2024
43454
Latin America & the Caribbean (IDA & IBRD countries)
TLA
false
2
1
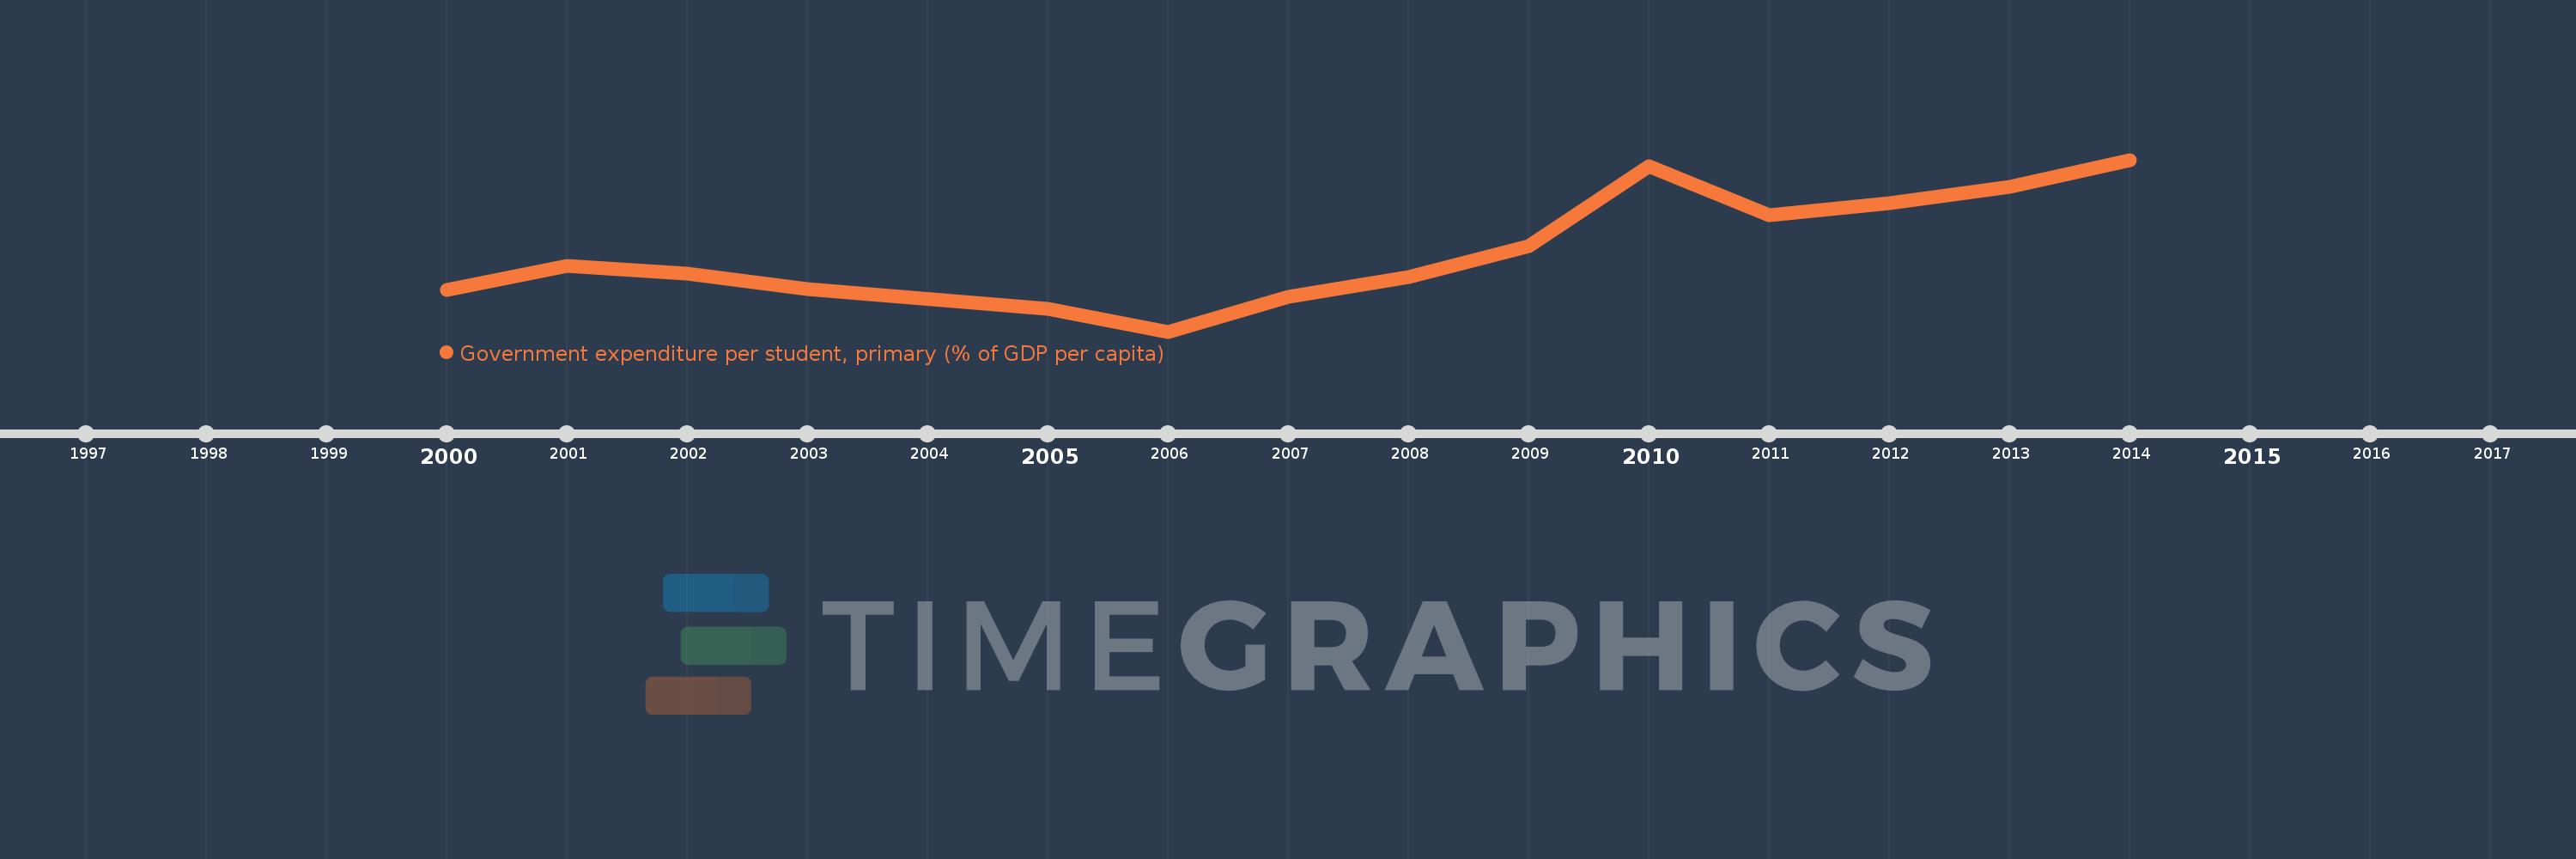
Government expenditure per student, primary (% of GDP per capita)
2014,2013,2012,2011,2010,2009,2008,2007,2006,2005,2003,2002,2001,2000
This statistics in other country:
Timeline:
This timeline shows a graph from 2000 to 2014 of Latin America & the Caribbean (IDA & IBRD countries). No data until 1999. Number of actual observations by date: 14.
Source name:
World Development Indicators
Source organization:
United Nations Educational, Scientific, and Cultural Organization (UNESCO) Institute for Statistics.
Categories, topics:
Education
Last updated:
apr 23, 2017
Indicators value changes by year
Maximum:
15.889
jan 1, 2014
At the date of observation
Value
Absolute change
Change from previous value
jan 1, 2000
10.633
+10.633
0.0%
jan 1, 2001
11.615
+0.982
9.24%
jan 1, 2002
11.3
-0.315
-2.71%
jan 1, 2003
10.666
-0.634
-5.61%
jan 1, 2005
9.871
-0.795
-7.45%
jan 1, 2006
8.944
-0.928
-9.4%
jan 1, 2007
10.353
+1.409
15.76%
jan 1, 2008
11.158
+0.805
7.77%
jan 1, 2009
12.39
+1.232
11.04%
jan 1, 2010
15.627
+3.237
26.12%
jan 1, 2011
13.643
-1.984
-12.69%
jan 1, 2012
14.133
+0.49
3.59%
jan 1, 2013
14.803
+0.67
4.74%
jan 1, 2014
15.889
+1.086
7.34%
Ranking of countries by current statistics by years
Comments: