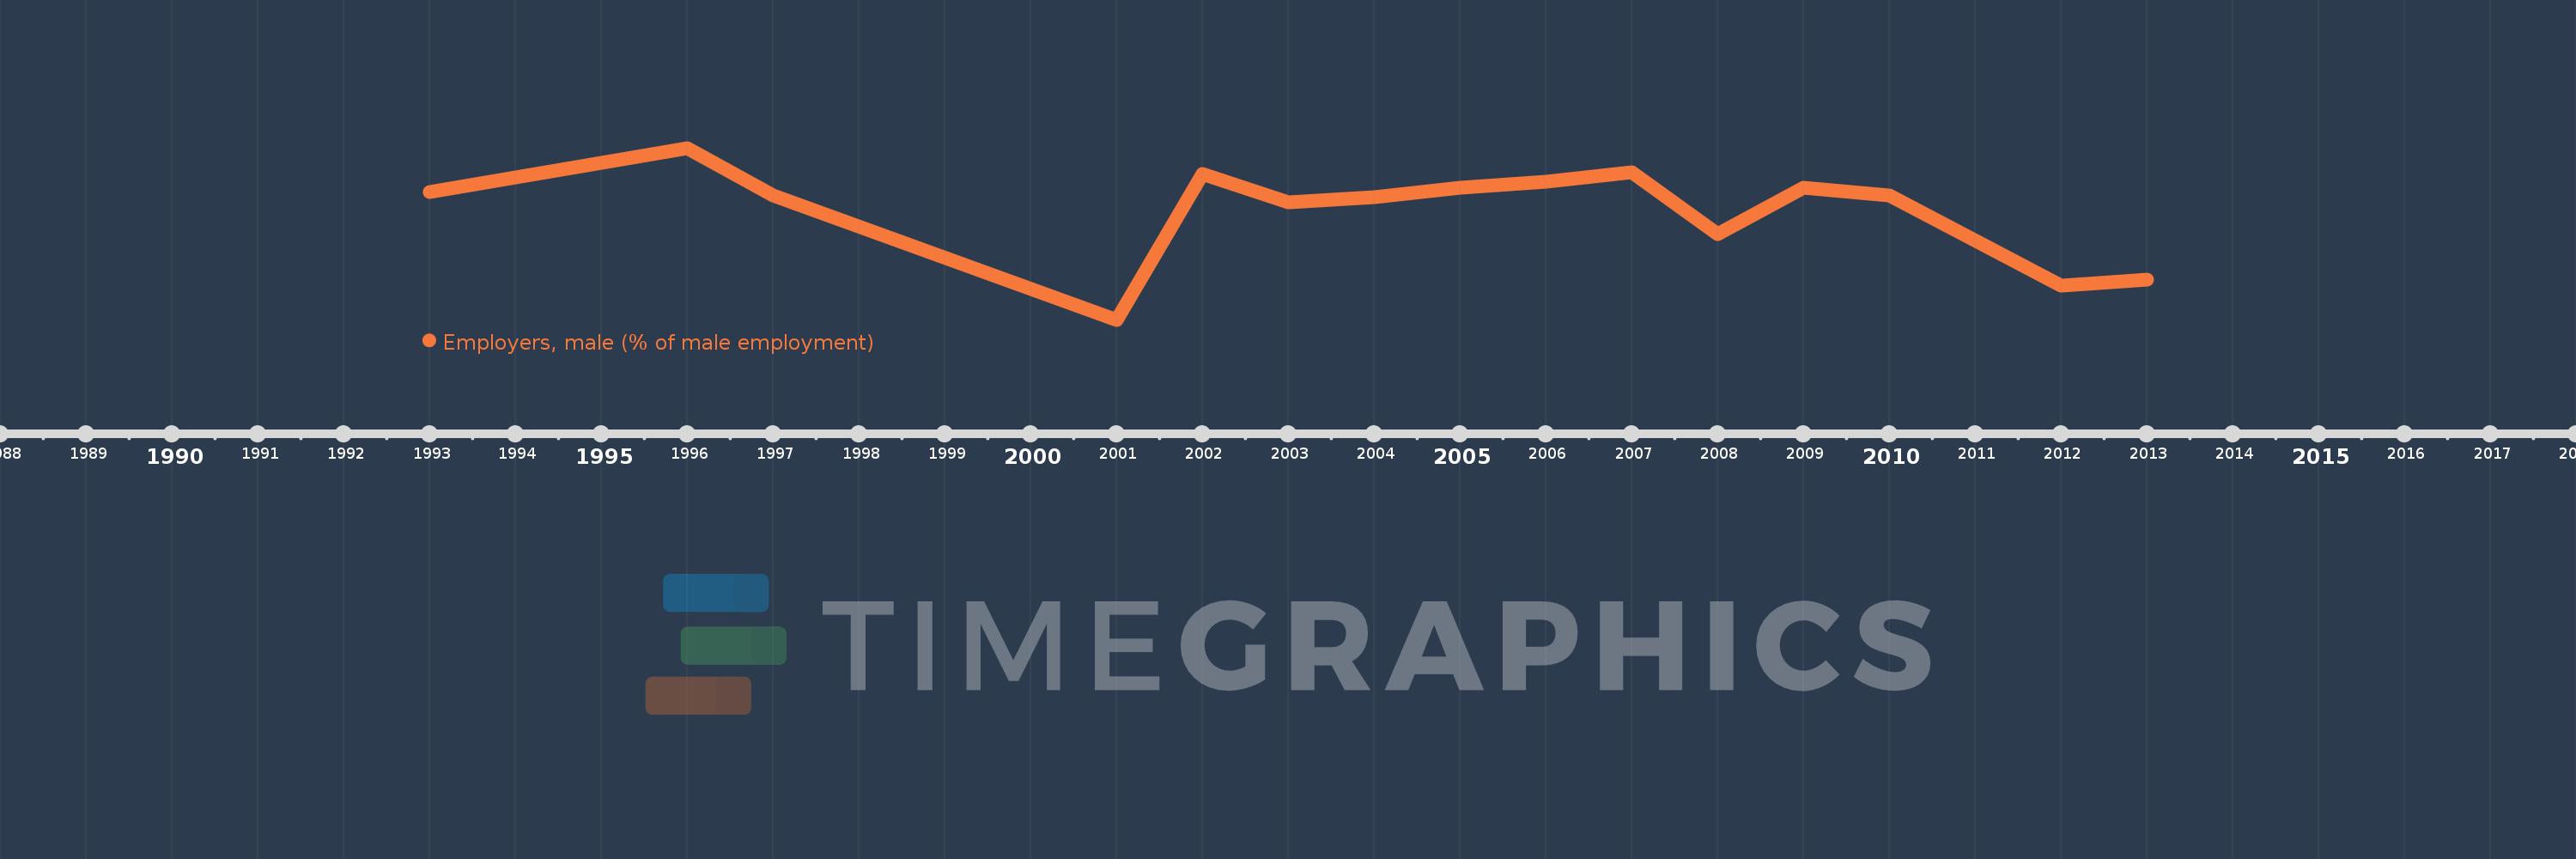
This timeline shows a graph from 1993 to 2013 of Latin America & the Caribbean (IDA & IBRD countries). No data until 1992. Number of actual observations by date: 15.
Source name:
World Development Indicators
Source organization:
ILO Key Indicators of the Labour Market (KILM).
Categories, topics:
Social Protection & Labor, Gender
Last updated:
apr 23, 2017
Indicators value changes by year
Meaning:
5.599
Minimum:
4.609
jan 1, 2001
Maximum:
6.161
jan 1, 1996
At the date of observation
Value
Absolute change
Change from the previous value
jan 1, 1993
5.765
+5.765
0.0%
jan 1, 1996
6.161
+0.396
6.87%
jan 1, 1997
5.73
-0.431
-7.0%
jan 1, 2001
4.609
-1.121
-19.56%
jan 1, 2002
5.922
+1.313
28.48%
jan 1, 2003
5.667
-0.254
-4.29%
jan 1, 2004
5.72
+0.053
0.93%
jan 1, 2005
5.799
+0.079
1.37%
jan 1, 2006
5.858
+0.059
1.02%
jan 1, 2007
5.945
+0.087
1.49%
jan 1, 2008
5.382
-0.563
-9.47%
jan 1, 2009
5.801
+0.418
7.77%
jan 1, 2010
5.732
-0.068
-1.18%
jan 1, 2012
4.92
-0.812
-14.17%
jan 1, 2013
4.975
+0.054
1.1%
Ranking of countries by current statistics by years