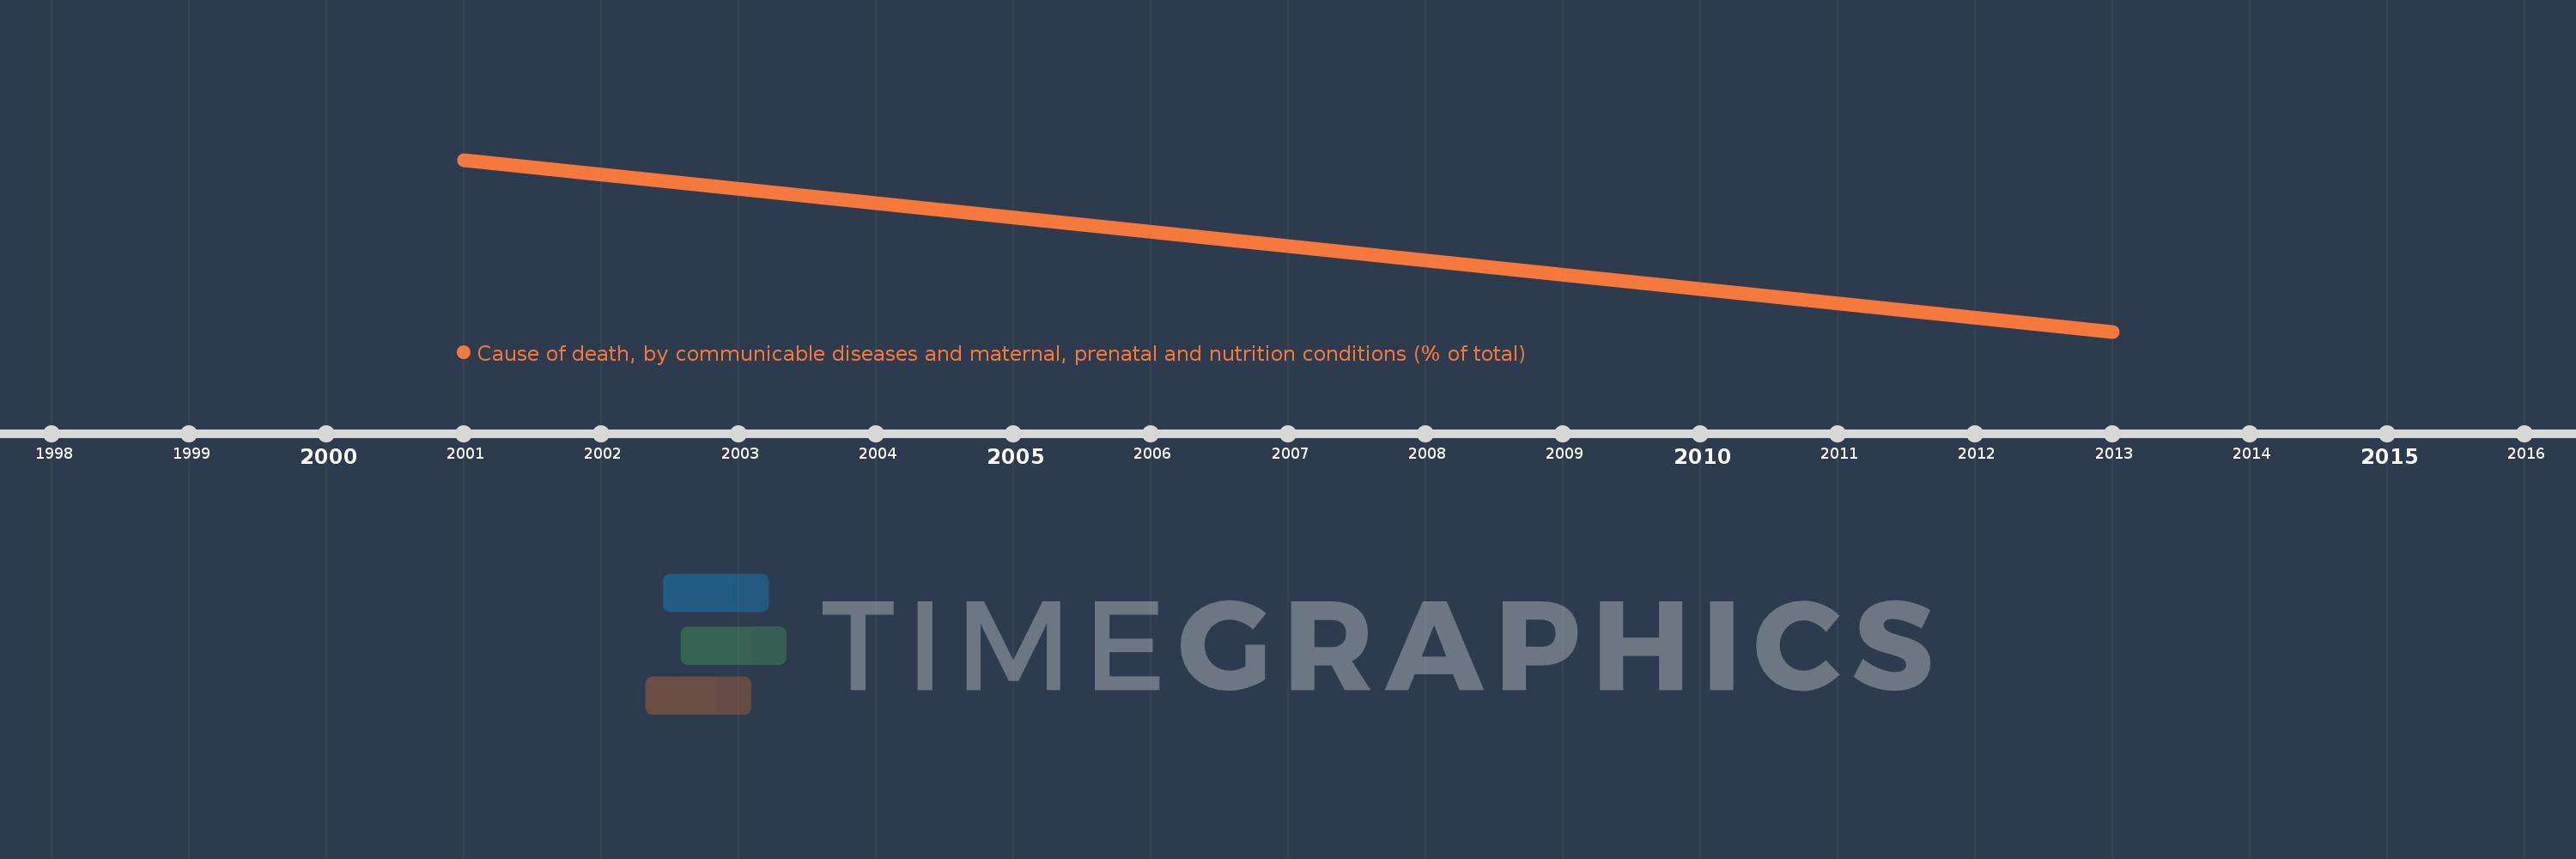
This timeline shows a graph from 2001 to 2013 of Latin America & the Caribbean (IDA & IBRD countries). No data until 2000. Number of actual observations by date: 2.
Source name:
World Development Indicators
Source organization:
Derived based on the data from WHO's World Health Statistics.
Categories, topics:
Health
Last updated:
apr 23, 2017
Indicators value changes by year
Meaning:
17.453
Minimum:
14.617
jan 1, 2013
Maximum:
20.288
jan 1, 2001
At the date of observation
Value
Absolute change
Change from the previous value
jan 1, 2001
20.288
+20.288
0.0%
jan 1, 2013
14.617
-5.671
-27.95%
Ranking of countries by current statistics by years