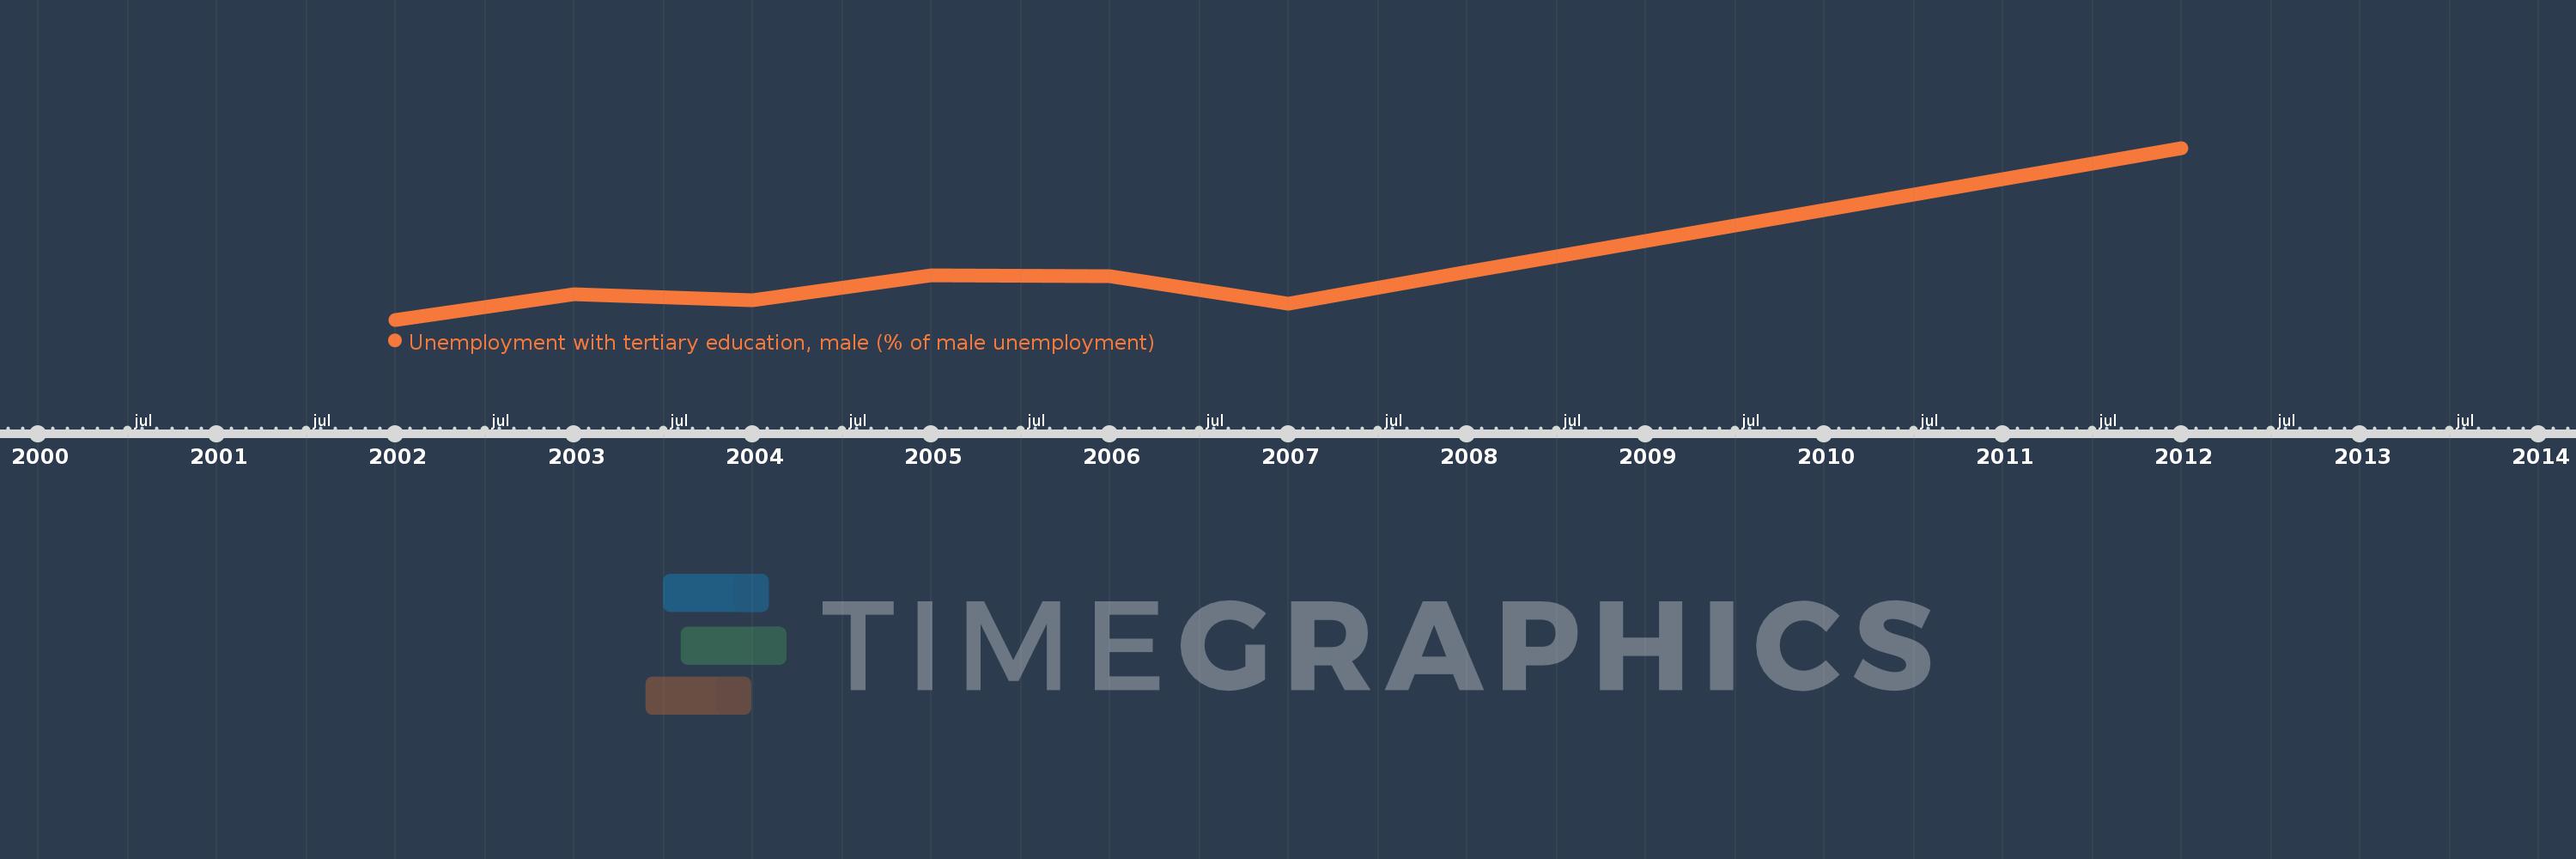
This timeline shows a graph from 2002 to 2012 of Latin America & Caribbean (excluding high income). No data until 2001. Number of actual observations by date: 8.
Source name:
World Development Indicators
Source organization:
International Labour Organization, Key Indicators of the Labour Market database.
Categories, topics:
Social Protection & Labor, Gender
Last updated:
apr 23, 2017
Indicators value changes by year
Meaning:
11.183
Minimum:
8.781
jan 1, 2002
Maximum:
17.741
jan 1, 2012
At the date of observation
Value
Absolute change
Change from the previous value
jan 1, 2002
8.781
+8.781
0.0%
jan 1, 2003
10.132
+1.351
15.39%
jan 1, 2004
9.788
-0.344
-3.4%
jan 1, 2005
11.103
+1.315
13.43%
jan 1, 2006
11.042
-0.061
-0.55%
jan 1, 2007
9.614
-1.428
-12.93%
jan 1, 2008
11.263
+1.649
17.16%
jan 1, 2012
17.741
+6.478
57.51%
Ranking of countries by current statistics by years