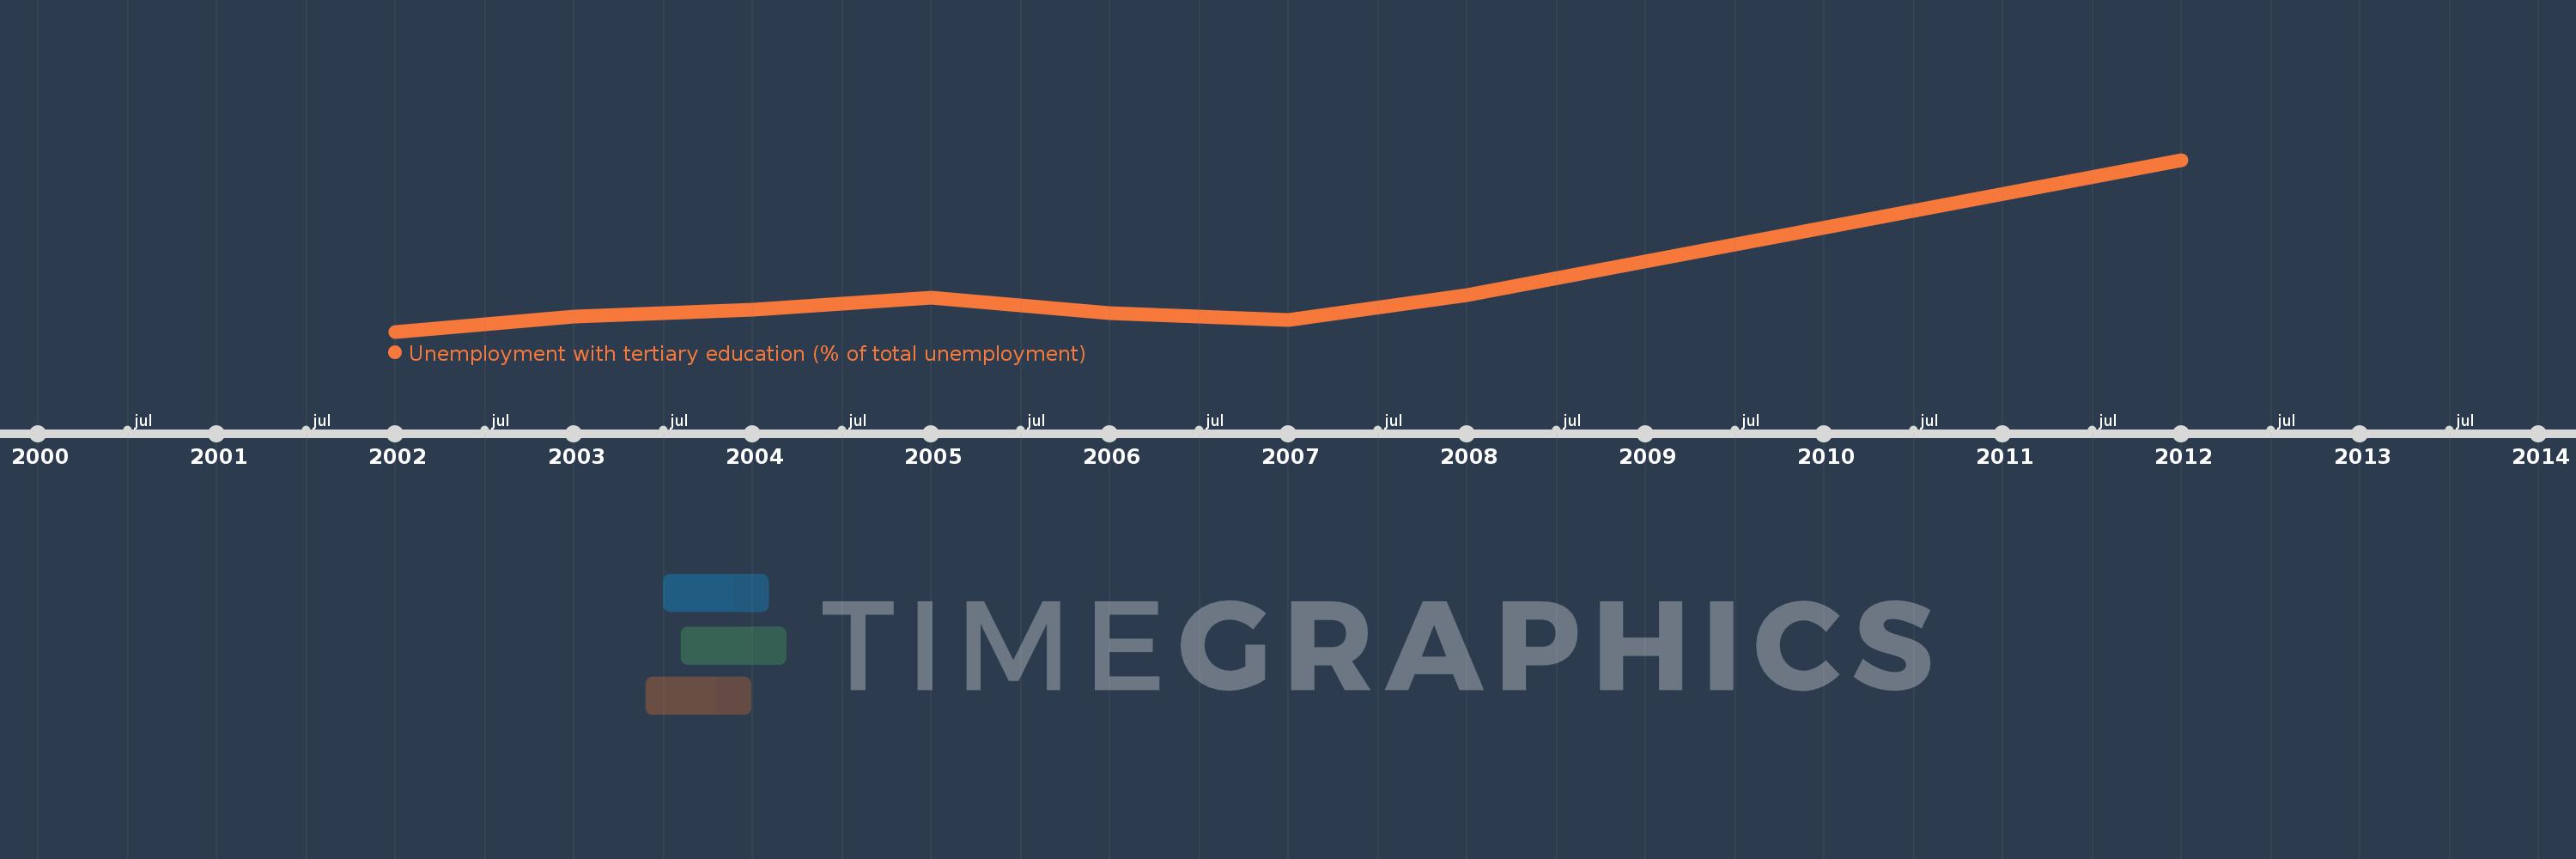
This timeline shows a graph from 2002 to 2012 of Latin America & Caribbean (excluding high income). No data until 2001. Number of actual observations by date: 8.
Source name:
World Development Indicators
Source organization:
International Labour Organization, Key Indicators of the Labour Market database.
Categories, topics:
Social Protection & Labor
Last updated:
apr 23, 2017
Indicators value changes by year
Meaning:
12.173
Minimum:
10.053
jan 1, 2002
Maximum:
19.497
jan 1, 2012
At the date of observation
Value
Absolute change
Change from the previous value
jan 1, 2002
10.053
+10.053
0.0%
jan 1, 2003
10.858
+0.806
8.01%
jan 1, 2004
11.243
+0.385
3.55%
jan 1, 2005
11.907
+0.663
5.9%
jan 1, 2006
11.072
-0.835
-7.01%
jan 1, 2007
10.697
-0.374
-3.38%
jan 1, 2008
12.058
+1.36
12.72%
jan 1, 2012
19.497
+7.44
61.7%
Ranking of countries by current statistics by years