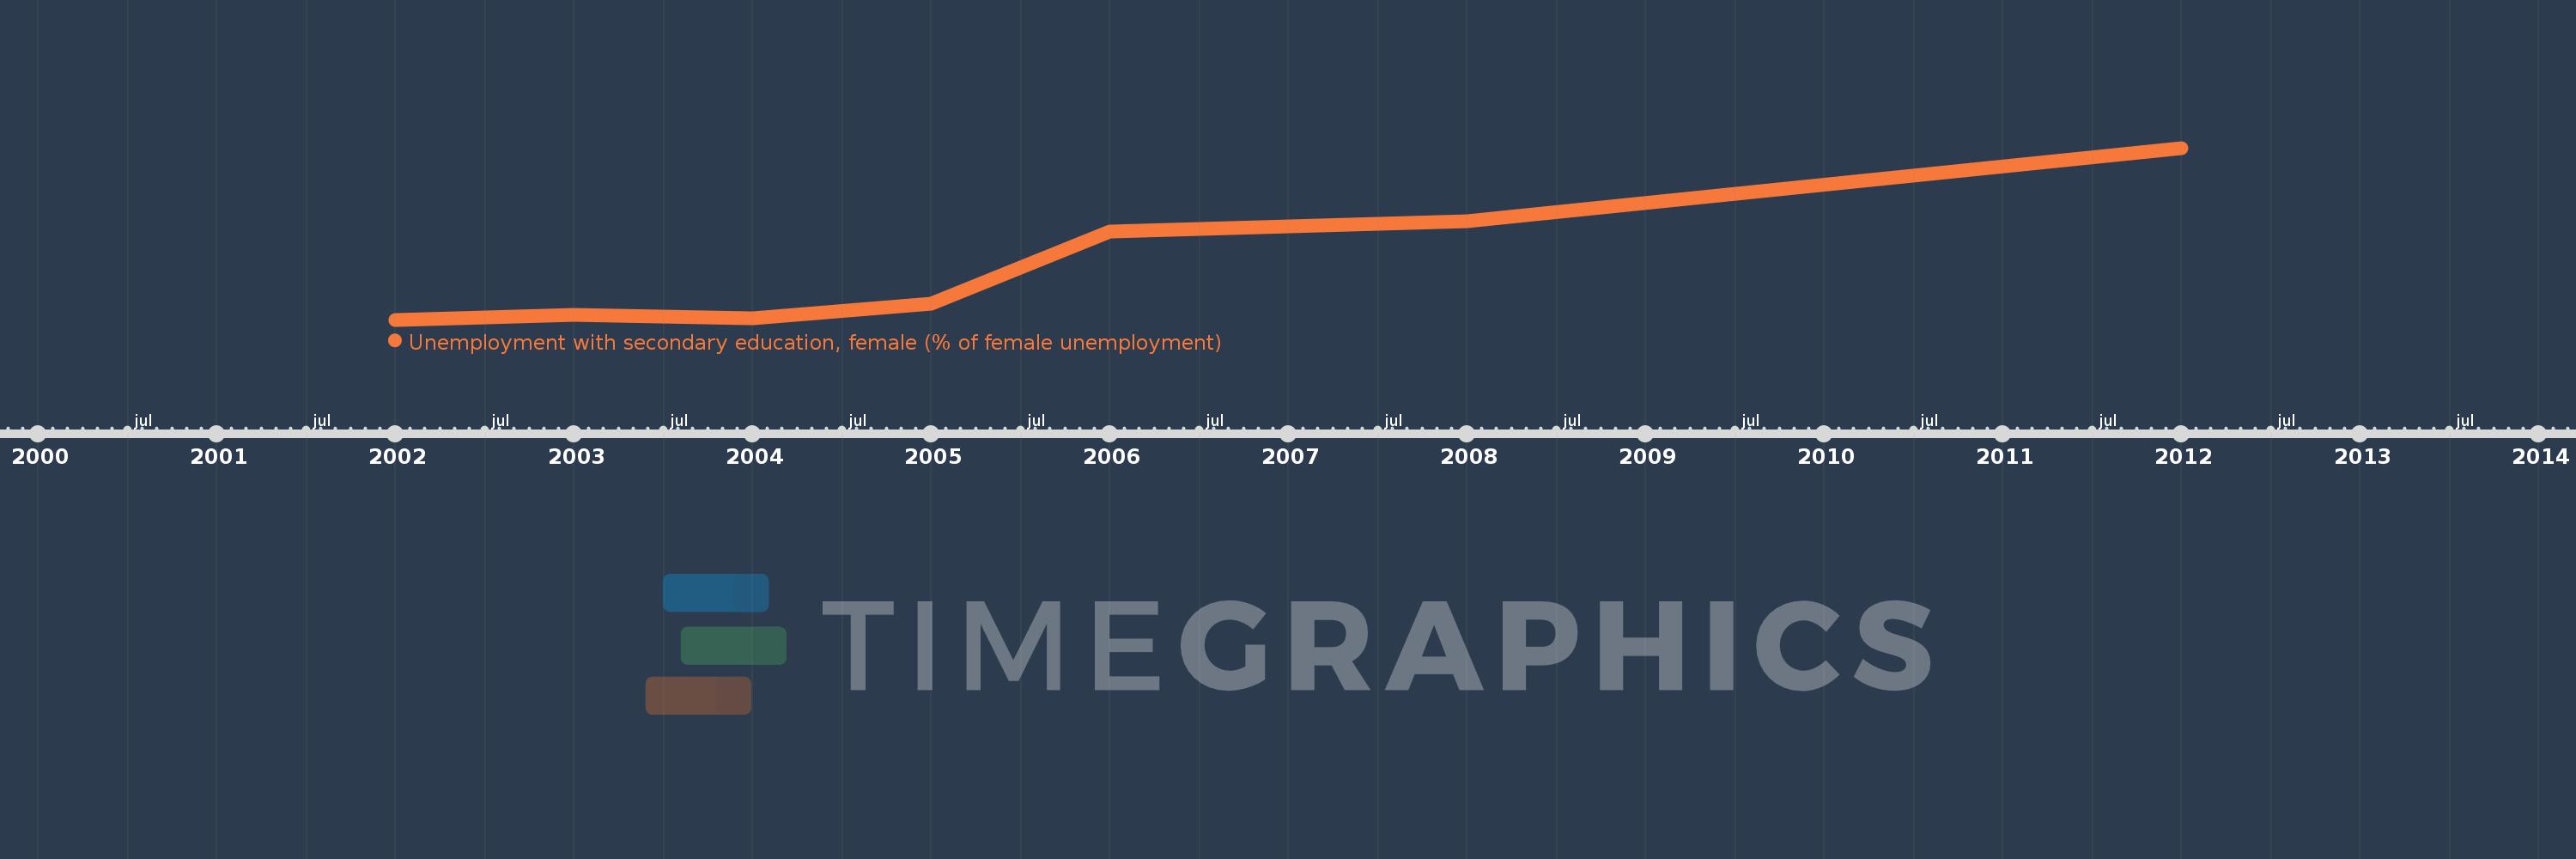
This timeline shows a graph from 2002 to 2012 of Latin America & Caribbean (excluding high income). No data until 2001. Number of actual observations by date: 8.
Source name:
World Development Indicators
Source organization:
International Labour Organization, Key Indicators of the Labour Market database.
Categories, topics:
Social Protection & Labor, Gender
Last updated:
apr 23, 2017
Indicators value changes by year
Meaning:
36.852
Minimum:
30.249
jan 1, 2002
Maximum:
49.438
jan 1, 2012
At the date of observation
Value
Absolute change
Change from the previous value
jan 1, 2002
30.249
+30.249
0.0%
jan 1, 2003
30.761
+0.512
1.69%
jan 1, 2004
30.378
-0.383
-1.25%
jan 1, 2005
32.016
+1.639
5.39%
jan 1, 2006
40.093
+8.076
25.23%
jan 1, 2007
40.65
+0.558
1.39%
jan 1, 2008
41.234
+0.583
1.44%
jan 1, 2012
49.438
+8.205
19.9%
Ranking of countries by current statistics by years