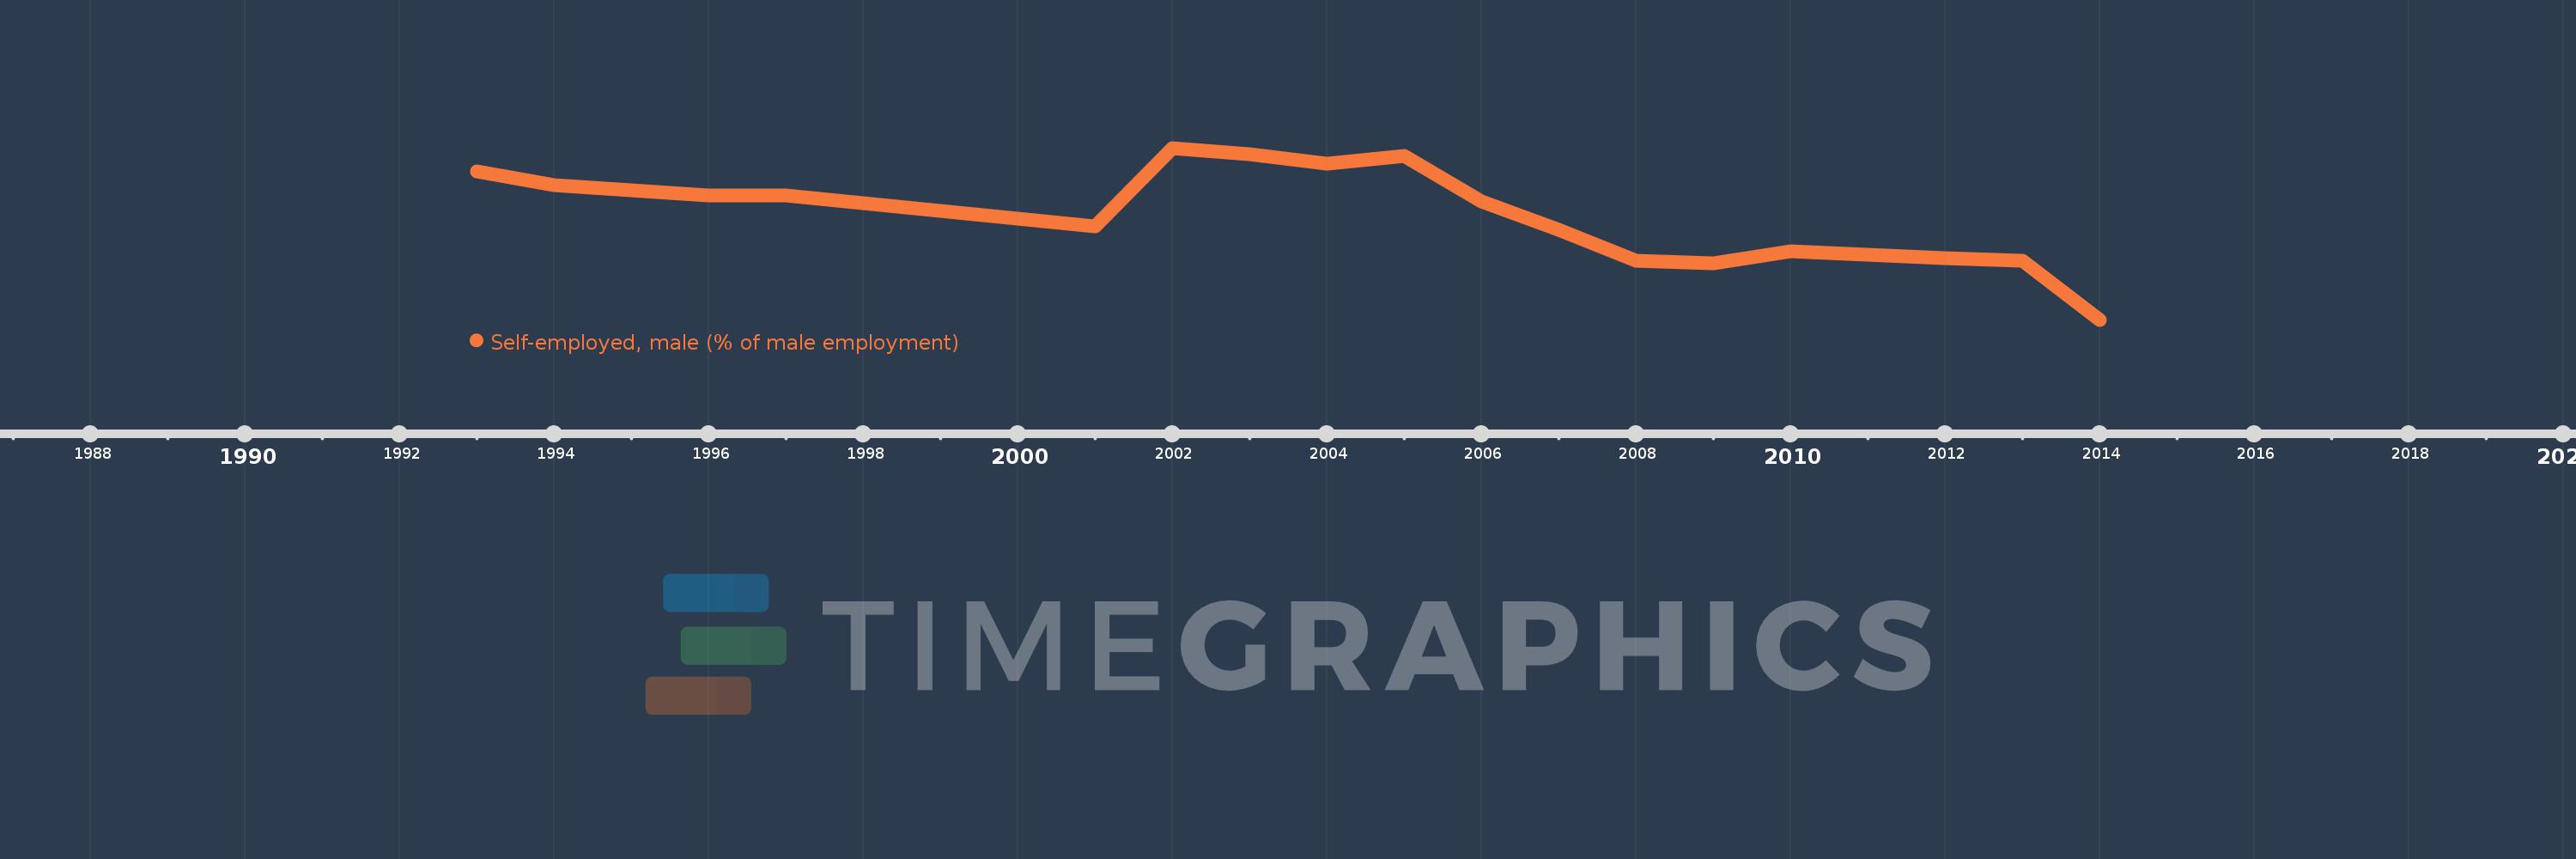
This timeline shows a graph from 1993 to 2014 of Latin America & Caribbean (excluding high income). No data until 1992. Number of actual observations by date: 17.
Source name:
World Development Indicators
Source organization:
International Labour Organization, Key Indicators of the Labour Market database.
Categories, topics:
Social Protection & Labor, Gender
Last updated:
apr 23, 2017
Indicators value changes by year
Meaning:
38.398
Minimum:
34.429
jan 1, 2014
Maximum:
40.88
jan 1, 2002
At the date of observation
Value
Absolute change
Change from the previous value
jan 1, 1993
39.999
+39.999
0.0%
jan 1, 1994
39.495
-0.504
-1.26%
jan 1, 1996
39.111
-0.385
-0.97%
jan 1, 1997
39.1
-0.01
-0.03%
jan 1, 2001
37.944
-1.156
-2.96%
jan 1, 2002
40.88
+2.936
7.74%
jan 1, 2003
40.658
-0.223
-0.54%
jan 1, 2004
40.28
-0.377
-0.93%
jan 1, 2005
40.57
+0.29
0.72%
jan 1, 2006
38.878
-1.693
-4.17%
jan 1, 2007
37.817
-1.06
-2.73%
jan 1, 2008
36.641
-1.176
-3.11%
jan 1, 2009
36.546
-0.095
-0.26%
jan 1, 2010
37.011
+0.464
1.27%
jan 1, 2012
36.75
-0.261
-0.7%
jan 1, 2013
36.654
-0.095
-0.26%
jan 1, 2014
34.429
-2.225
-6.07%
Ranking of countries by current statistics by years