30
/
AIzaSyAYiBZKx7MnpbEhh9jyipgxe19OcubqV5w
April 1, 2024
42134
Latin America & Caribbean (excluding high income)
LAC
false
2
1
Binding coverage, all products (%)
2013,2011,2010,2009,2008,2007,2006,2005,2004,2003,2002,2001,2000,1999,1998,1997
Download
Global statistics library →Latin America & Caribbean (excluding high income) →

Binding coverage, all products (%)

This statistics in other country:

AlbaniaAngolaAntigua and BarbudaArgentinaArmeniaAustraliaAustriaBahrainBangladeshBarbadosBelgiumBelizeBeninBoliviaBotswanaBrazilBrunei DarussalamBulgariaBurkina FasoBurundiCabo VerdeCambodiaCameroonCanadaCentral African RepublicChadChileChinaColombiaCongo, Dem. Rep.Congo, Rep.Costa RicaCote d'IvoireCroatiaCubaCyprusCzech RepublicDenmarkDjiboutiDominicaDominican RepublicEast Asia & Pacific (excluding high income)EcuadorEgypt, Arab Rep.El SalvadorEstoniaEurope & Central Asia (excluding high income)European UnionFijiFinlandFranceGabonGambia, TheGeorgiaGermanyGhanaGreeceGrenadaGuatemalaGuineaGuinea-BissauGuyanaHaitiHigh incomeHondurasHong Kong SAR, ChinaHungaryIcelandIndiaIndonesiaIrelandIsraelItalyJamaicaJapanJordanKenyaKorea, Rep.KuwaitKyrgyz RepublicLatin America & Caribbean (excluding high income)LatviaLesothoLithuaniaLow & middle incomeLow incomeLower middle incomeLuxembourgMacao SAR, ChinaMacedonia, FYRMadagascarMalawiMalaysiaMaldivesMaliMaltaMauritaniaMauritiusMexicoMiddle East & North Africa (excluding high income)Middle incomeMoldovaMongoliaMoroccoMozambiqueMyanmarNamibiaNepalNetherlandsNew ZealandNicaraguaNigerNigeriaNorwayOECD membersOmanPakistanPanamaPapua New GuineaParaguayPeruPhilippinesPolandPortugalQatarRomaniaRwandaSaudi ArabiaSenegalSierra LeoneSingaporeSlovak RepublicSloveniaSolomon IslandsSouth AfricaSouth AsiaSpainSri LankaSt. Kitts and NevisSt. LuciaSt. Vincent and the GrenadinesSub-Saharan Africa (excluding high income)SurinameSwazilandSwedenSwitzerlandTanzaniaThailandTogoTongaTrinidad and TobagoTunisiaTurkeyUgandaUkraineUnited Arab EmiratesUnited KingdomUnited StatesUpper middle incomeUruguayVenezuela, RBVietnamWorldZambiaZimbabwe

Timeline:

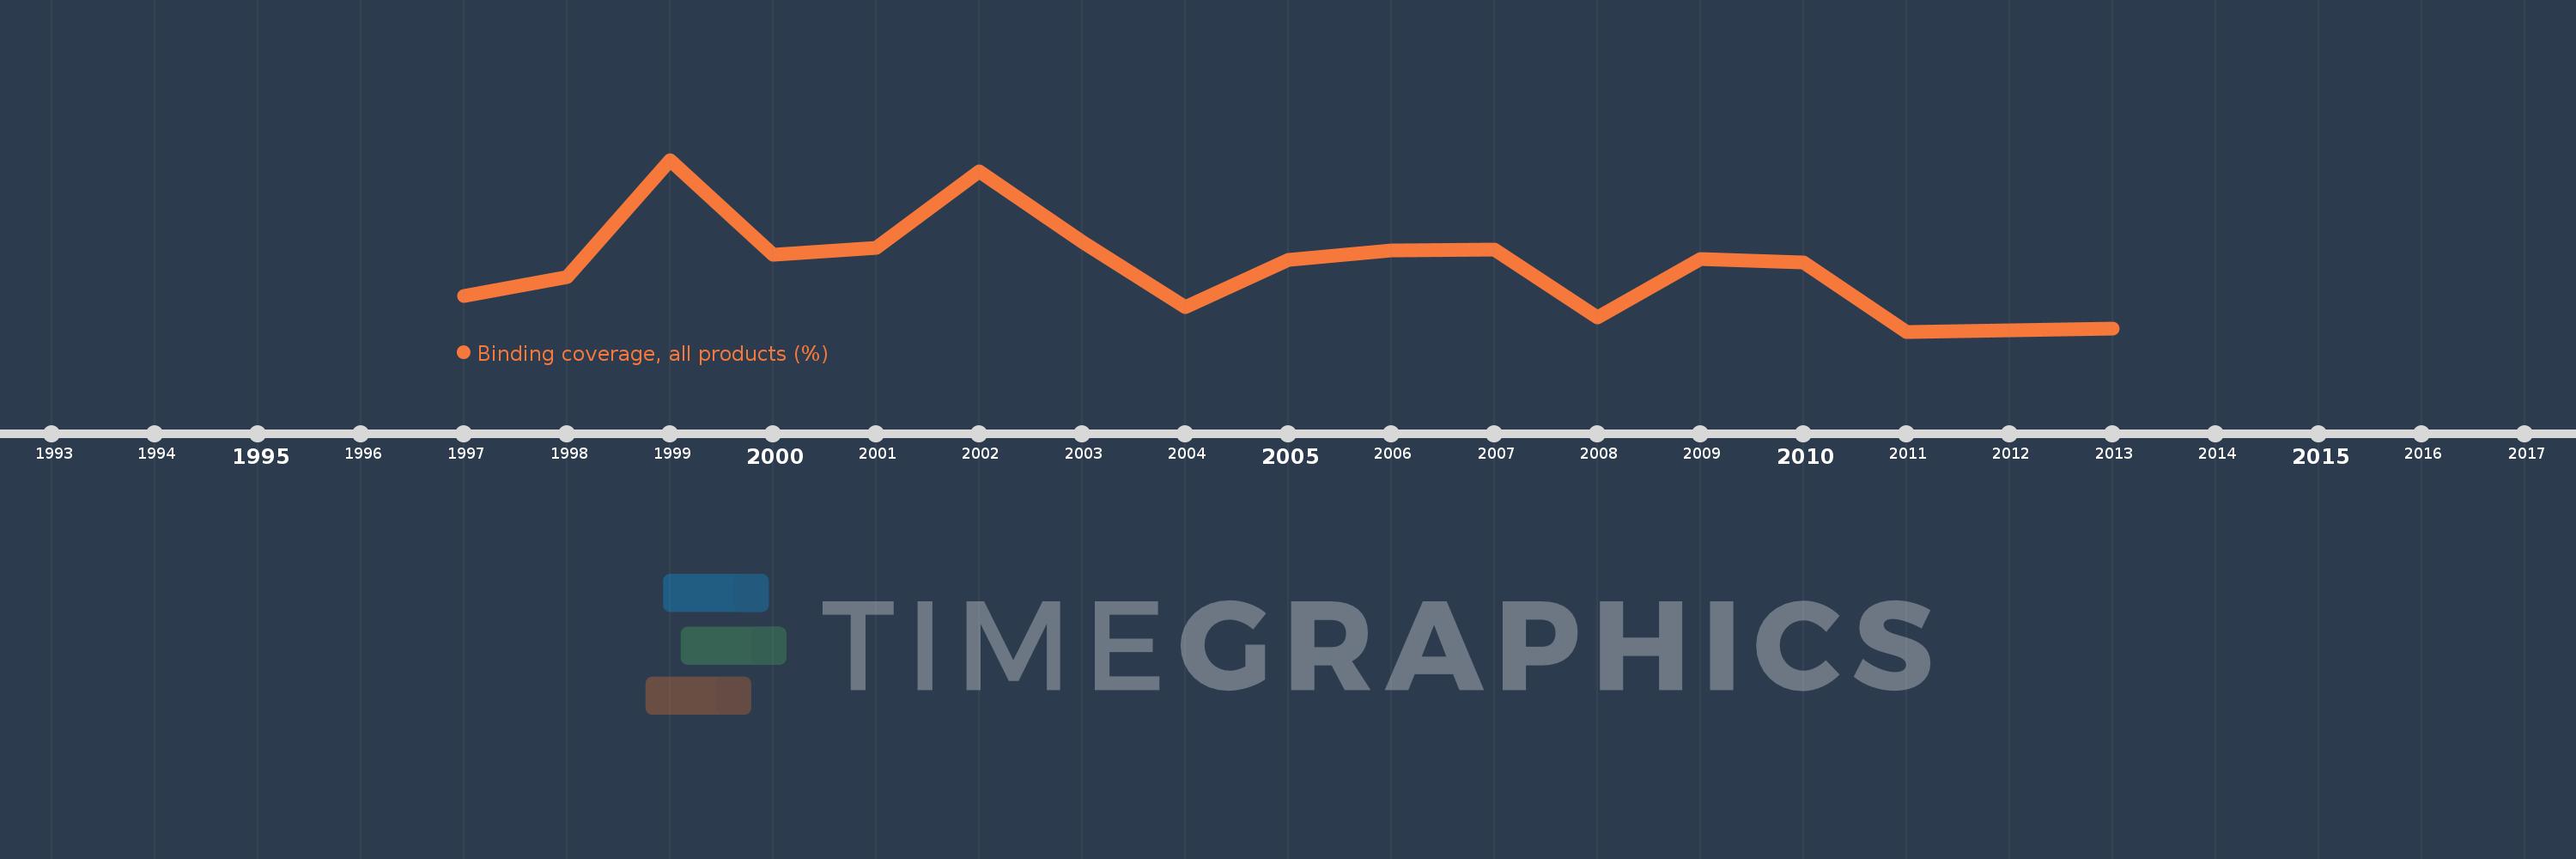
This timeline shows a graph from 1997 to 2013 of Latin America & Caribbean (excluding high income). No data until 1996. Number of actual observations by date: 16.

Source name:

World Development Indicators

Source organization:

World Bank staff estimates using the World Integrated Trade Solution system, based on data from World Trade Organization.

Categories, topics:

Private Sector, Trade

Last updated:

apr 23, 2017

Indicators value changes by year

Meaning:
96.017
Minimum:
93.4
jan 1, 2011
Maximum:
99.99
jan 1, 1999
At the date of observation
Value
Absolute change
Change from the previous value
jan 1, 1997
94.76
+94.76
0.0%
jan 1, 1998
95.49
+0.73
0.77%
jan 1, 1999
99.99
+4.5
4.71%
jan 1, 2000
96.36
-3.63
-3.63%
jan 1, 2001
96.6
+0.24
0.25%
jan 1, 2002
99.56
+2.96
3.06%
jan 1, 2003
96.84
-2.72
-2.73%
jan 1, 2004
94.35
-2.49
-2.57%
jan 1, 2005
96.16
+1.81
1.92%
jan 1, 2006
96.52
+0.36
0.37%
jan 1, 2007
96.55
+0.03
0.03%
jan 1, 2008
93.93
-2.62
-2.71%
jan 1, 2009
96.18
+2.25
2.4%
jan 1, 2010
96.05
-0.13
-0.14%
jan 1, 2011
93.4
-2.65
-2.76%
jan 1, 2013
93.53
+0.13
0.14%

Ranking of countries by current statistics by years