33
/
AIzaSyB4mHJ5NPEv-XzF7P6NDYXjlkCWaeKw5bc
November 1, 2025
42098
Latin America & Caribbean (excluding high income)
LAC
false
2
1
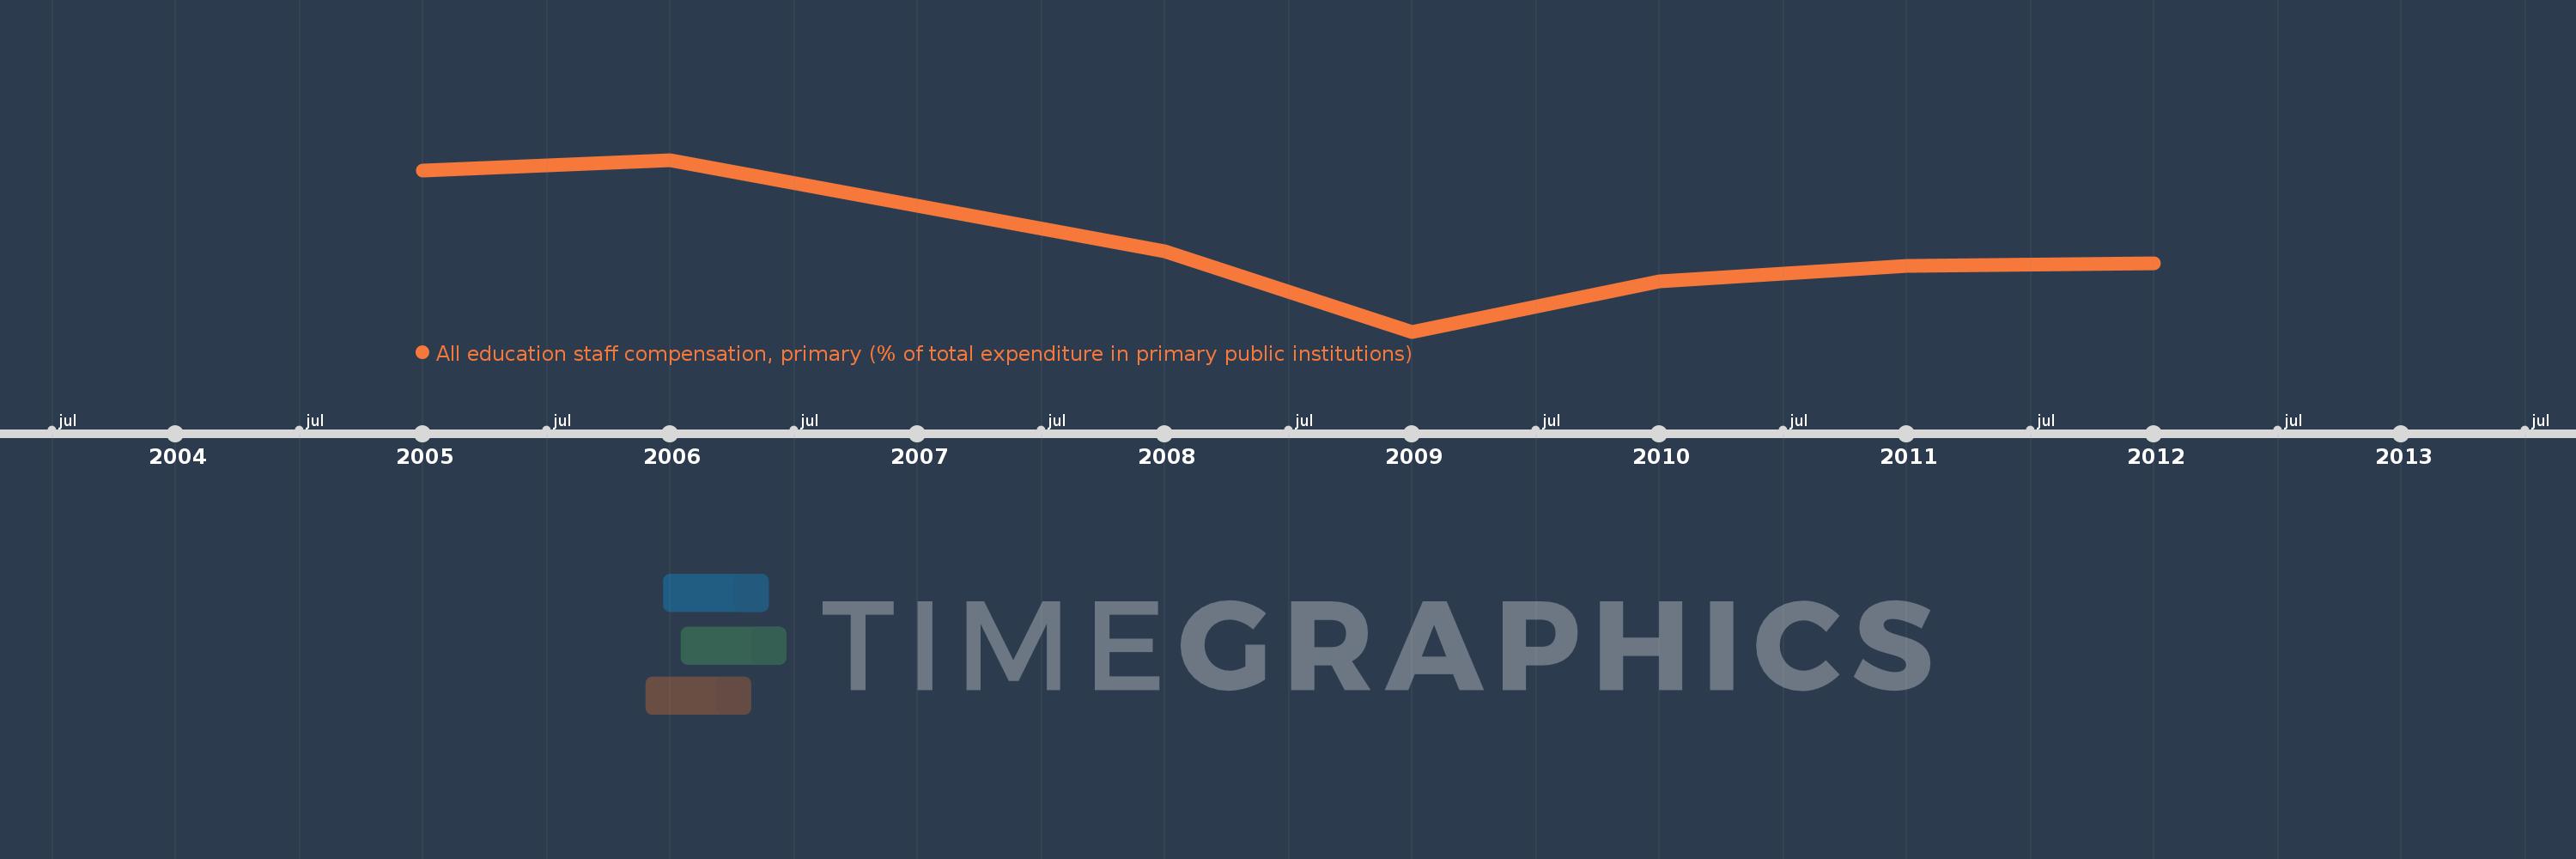
All education staff compensation, primary (% of total expenditure in primary public institutions)
2012,2011,2010,2009,2008,2006,2005