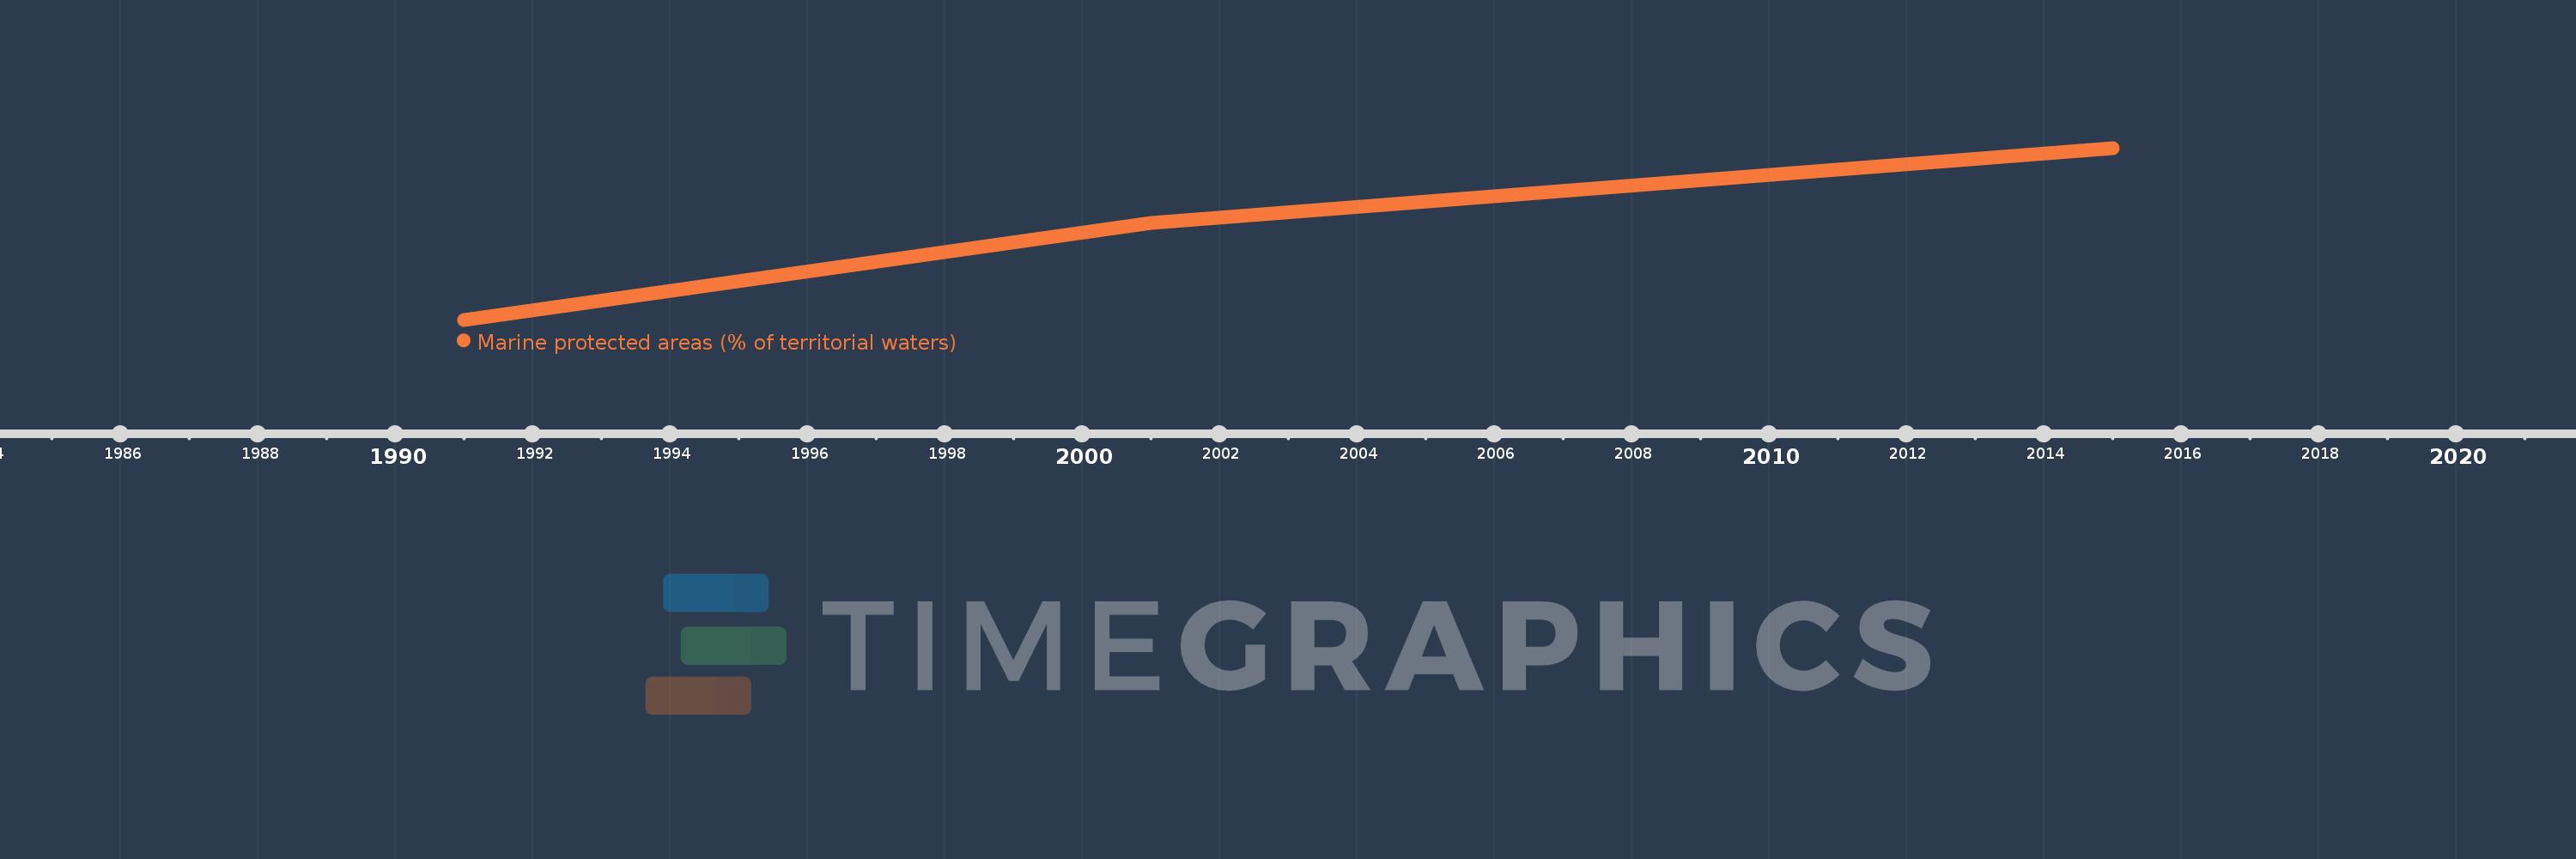
This timeline shows a graph from 1991 to 2015 of Latin America & Caribbean . No data until 1990. Number of actual observations by date: 3.
Source name:
World Development Indicators
Source organization:
United Nations Environmental Program and the World Conservation Monitoring Centre, as compiled by the World Resources Institute, based on data from national authorities, national legislation and international agreements.
Categories, topics:
Climate Change, Environment
Last updated:
apr 23, 2017
Indicators value changes by year
Meaning:
9.846
Minimum:
3.657
jan 1, 1991
Maximum:
15.545
jan 1, 2015
At the date of observation
Value
Absolute change
Change from the previous value
jan 1, 1991
3.657
+3.657
0.0%
jan 1, 2001
10.335
+6.678
182.63%
jan 1, 2015
15.545
+5.21
50.41%
Ranking of countries by current statistics by years