Download This statistics in other country:
Timeline:
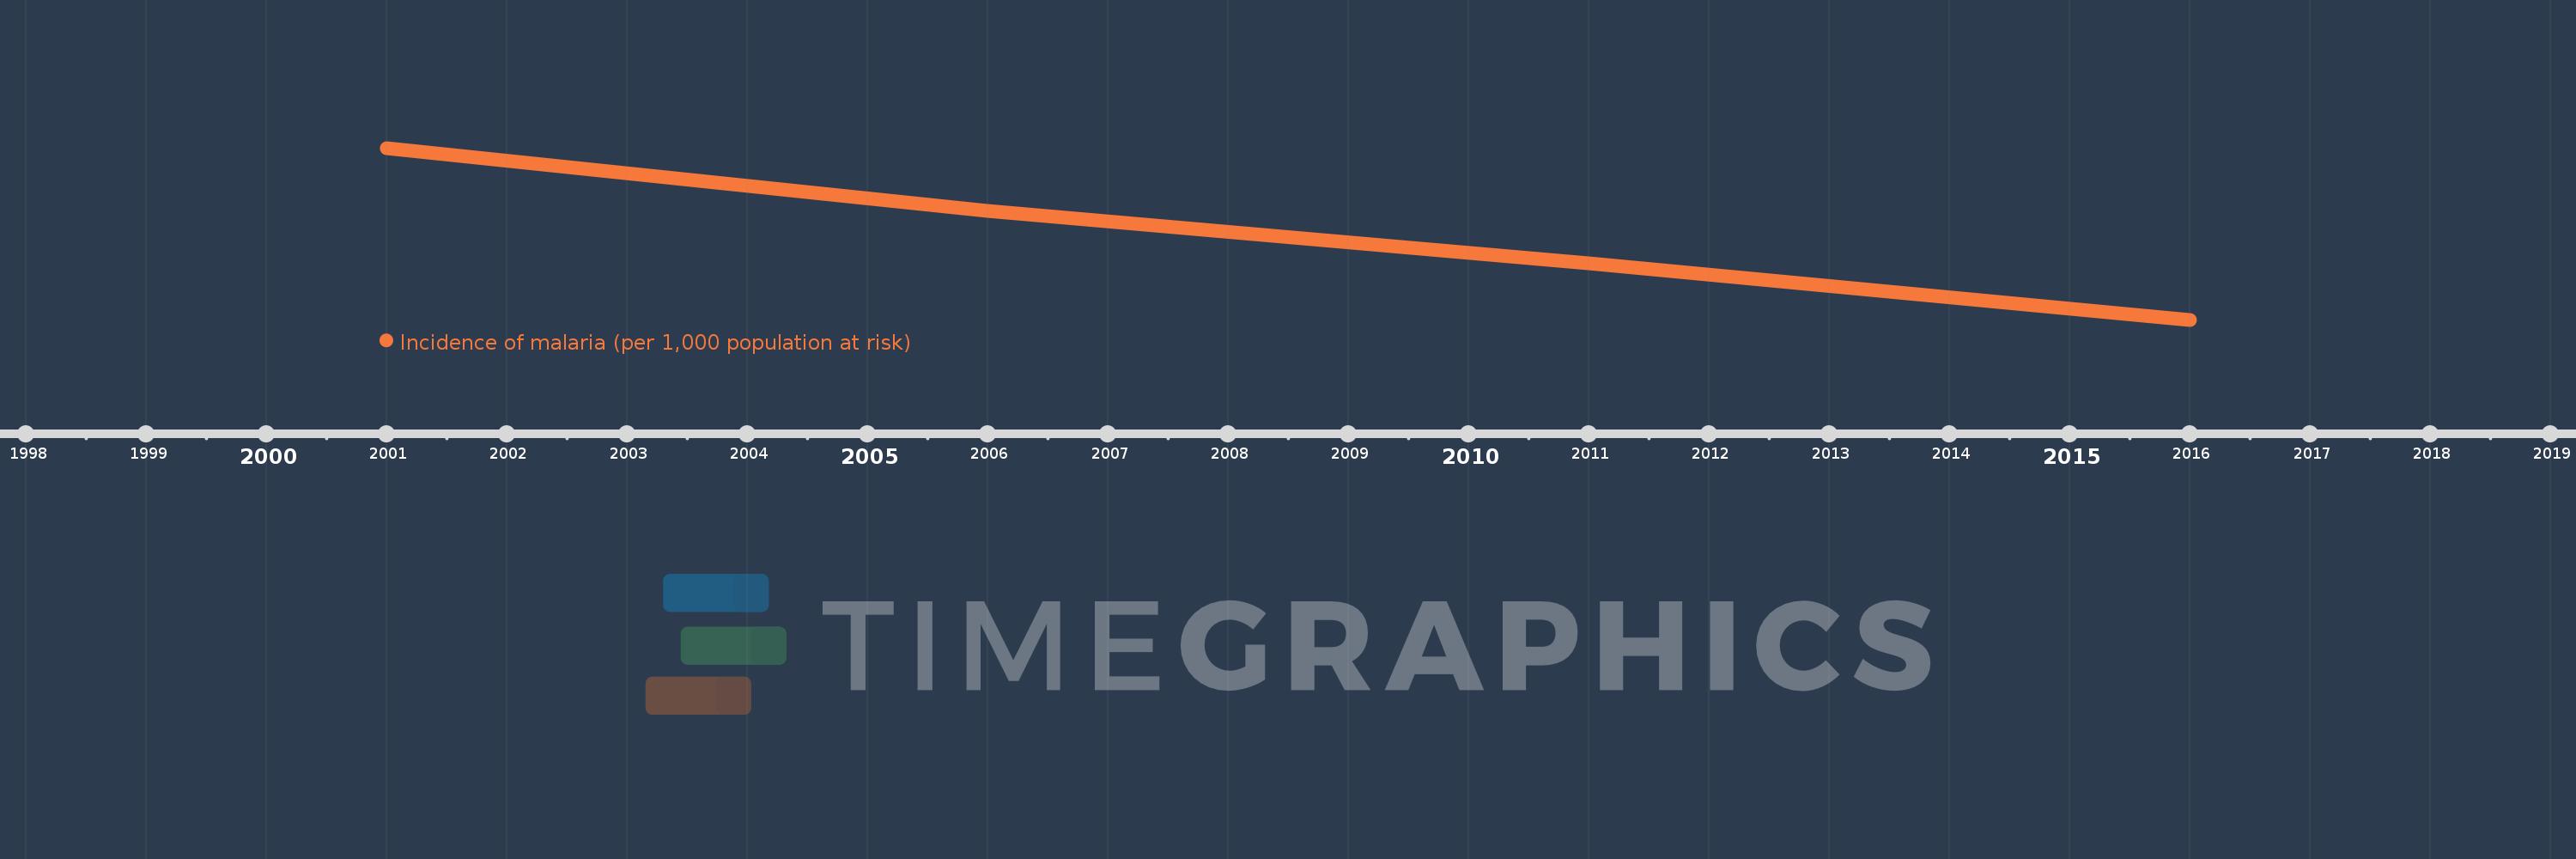
This timeline shows a graph from 2001 to 2016 of IDA total. No data until 2000. Number of actual observations by date: 4.
Source name:
World Development Indicators
Source organization:
World Health Organization, Global Health Observatory Data Repository/World Health Statistics (http://apps.who.int/ghodata/).
Categories, topics:
Health
Last updated:
apr 23, 2017
Indicators value changes by year
Minimum:
181.979
jan 1, 2016
Maximum:
324.503
jan 1, 2001
At the date of observation
Value
Absolute change
Change from the previous value
jan 1, 2001
324.503
+324.503
0.0%
jan 1, 2006
272.571
-51.932
-16.0%
jan 1, 2011
228.622
-43.949
-16.12%
jan 1, 2016
181.979
-46.643
-20.4%
Ranking of countries by current statistics by years