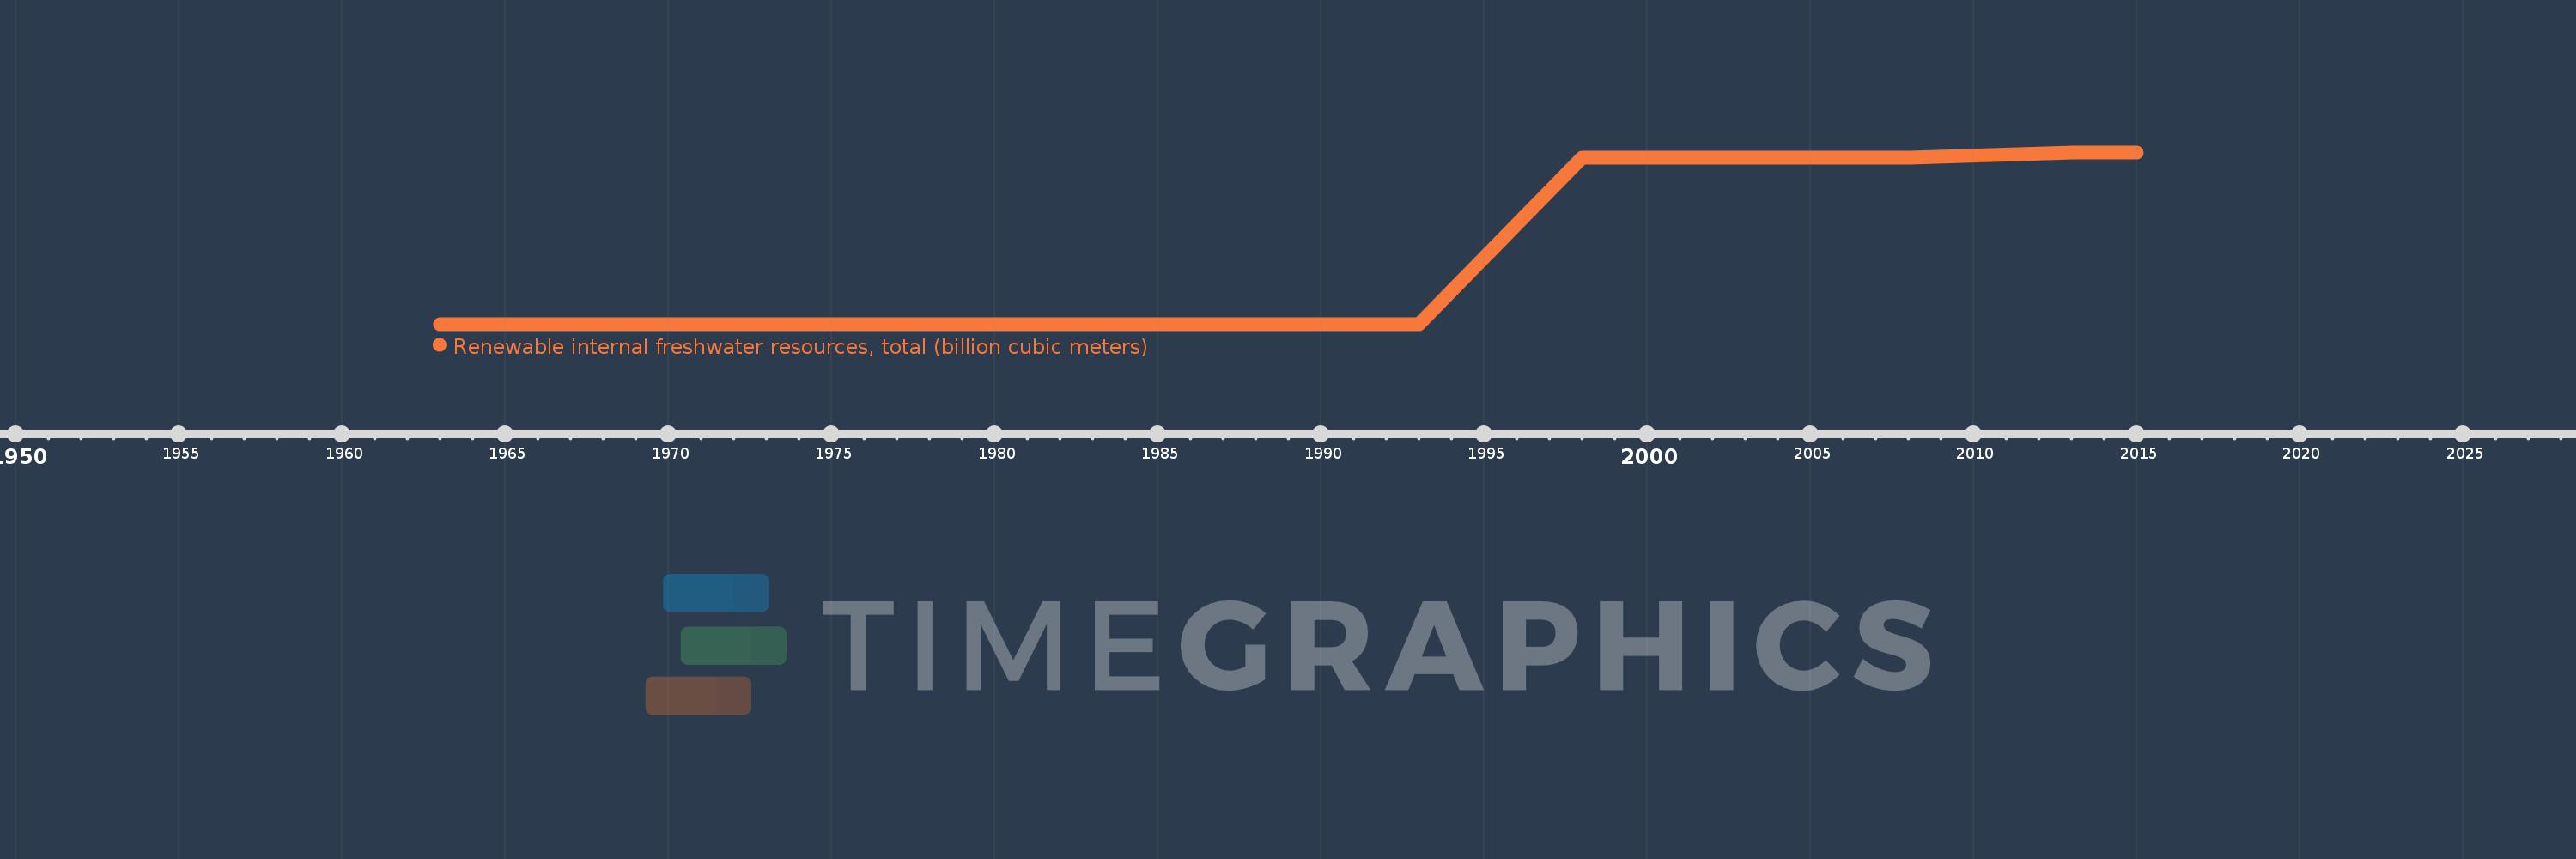
This timeline shows a graph from 1963 to 2015 of Heavily indebted poor countries (HIPC). No data until 1962. Number of actual observations by date: 12.
Source name:
World Development Indicators
Source organization:
Food and Agriculture Organization, AQUASTAT data.
Categories, topics:
Infrastructure, Environment
Last updated:
apr 23, 2017
Indicators value changes by year
Meaning:
3.977K
Minimum:
3.924K
jan 1, 1963
Maximum:
4.053K
jan 1, 2013
At the date of observation
Value
Absolute change
Change from the previous value
jan 1, 1963
3.924K
+3.924K
0.0%
jan 1, 1968
3.924K
0.0
0.0%
jan 1, 1973
3.924K
0.0
0.0%
jan 1, 1978
3.924K
0.0
0.0%
jan 1, 1983
3.924K
0.0
0.0%
jan 1, 1988
3.924K
0.0
0.0%
jan 1, 1993
3.924K
0.0
0.0%
jan 1, 1998
4.049K
+124.8
3.18%
jan 1, 2003
4.049K
0.0
0.0%
jan 1, 2008
4.049K
0.0
0.0%
jan 1, 2013
4.053K
+4.0
0.1%
jan 1, 2015
4.053K
0.0
0.0%
Ranking of countries by current statistics by years