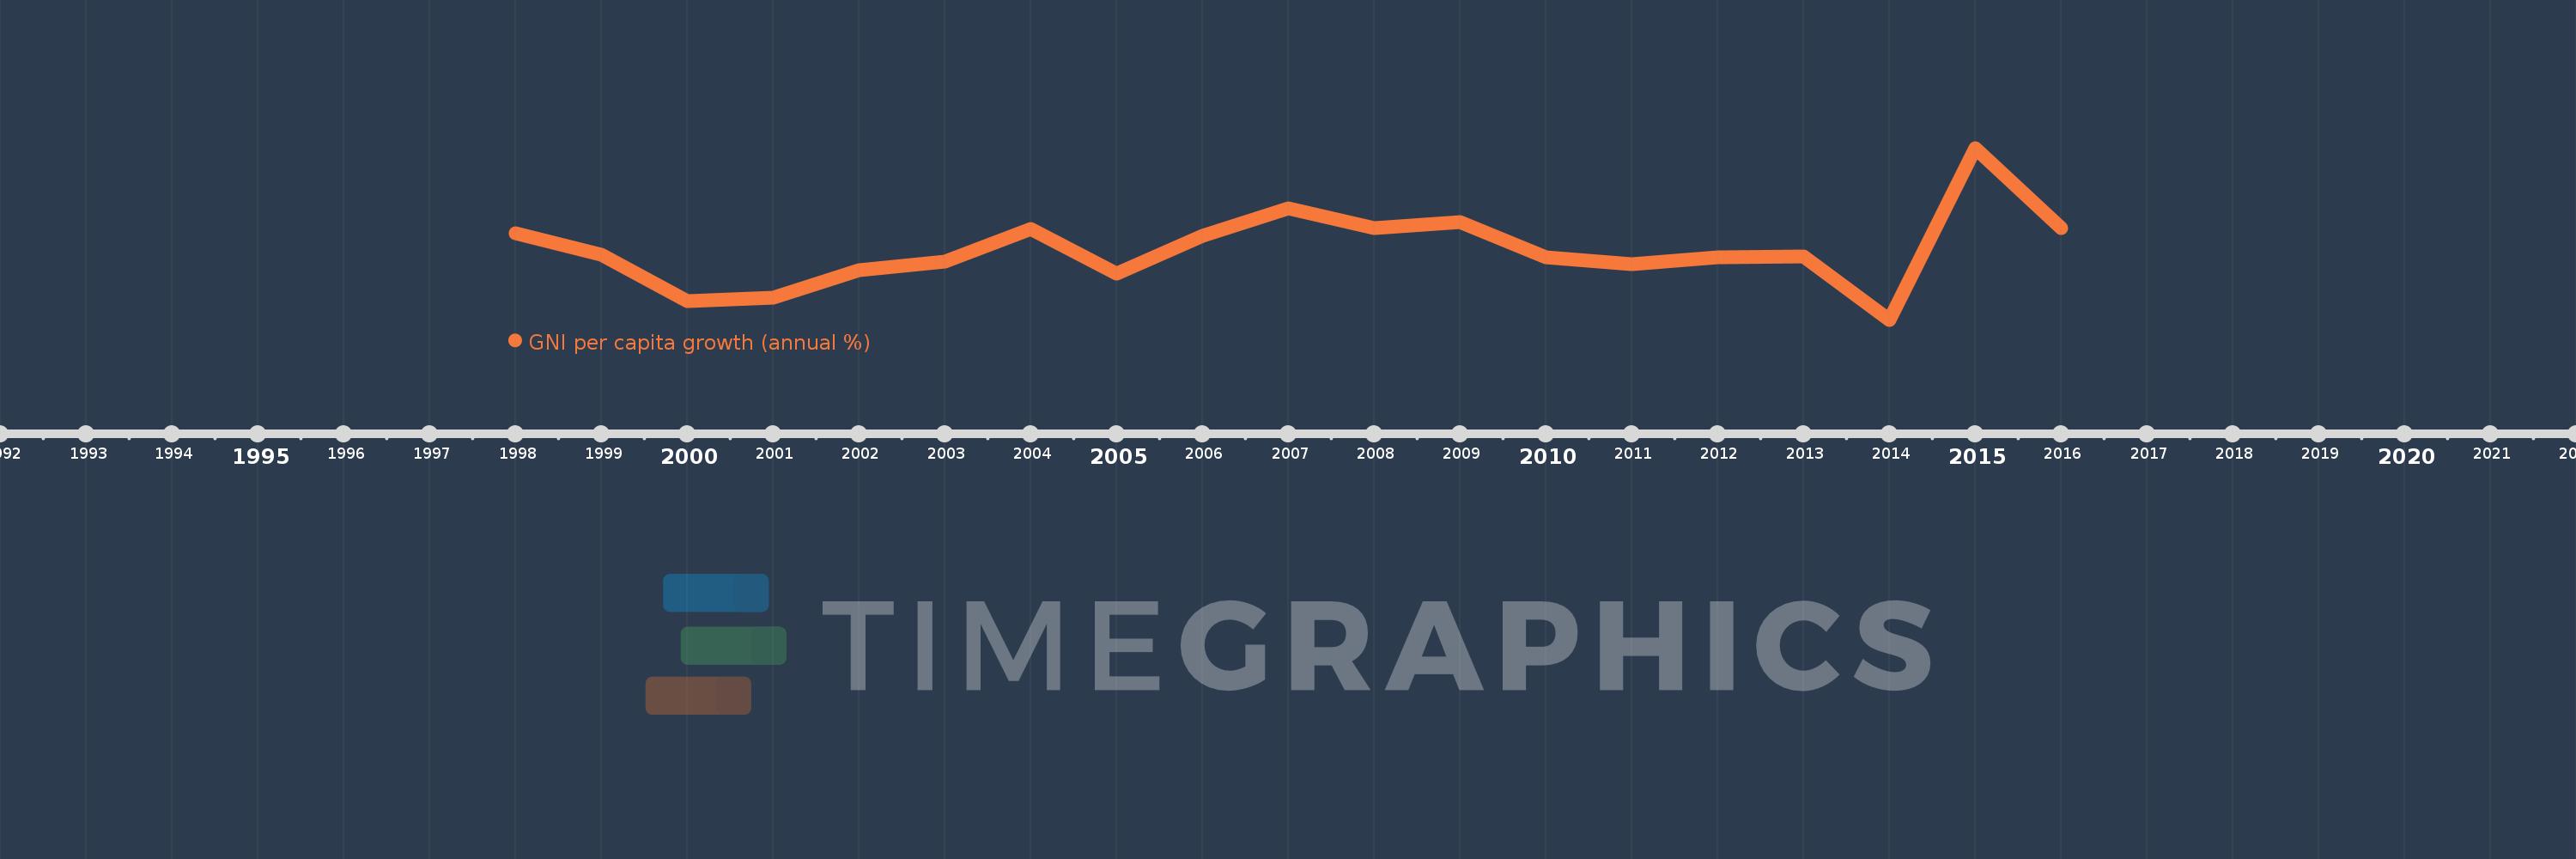
This timeline shows a graph from 1998 to 2016 of Heavily indebted poor countries (HIPC). No data until 1997. Number of actual observations by date: 19.
Source name:
World Development Indicators
Source organization:
World Bank national accounts data, and OECD National Accounts data files.
Categories, topics:
Economy & Growth
Last updated:
apr 23, 2017
Indicators value changes by year
Meaning:
2.048
Minimum:
-1.366
jan 1, 2014
Maximum:
7.033
jan 1, 2015
At the date of observation
Value
Absolute change
Change from the previous value
jan 1, 1998
2.852
+2.852
0.0%
jan 1, 1999
1.795
-1.056
-37.04%
jan 1, 2000
-0.454
-2.249
-125.26%
jan 1, 2001
-0.307
+0.146
-32.21%
jan 1, 2002
1.047
+1.354
-440.48%
jan 1, 2003
1.457
+0.41
39.15%
jan 1, 2004
3.071
+1.614
110.81%
jan 1, 2005
0.872
-2.199
-71.61%
jan 1, 2006
2.72
+1.848
211.95%
jan 1, 2007
4.069
+1.348
49.57%
jan 1, 2008
3.129
-0.939
-23.09%
jan 1, 2009
3.428
+0.299
9.55%
jan 1, 2010
1.679
-1.749
-51.02%
jan 1, 2011
1.364
-0.315
-18.75%
jan 1, 2012
1.68
+0.316
23.19%
jan 1, 2013
1.727
+0.047
2.78%
jan 1, 2014
-1.366
-3.093
-179.08%
jan 1, 2015
7.033
+8.399
-614.96%
jan 1, 2016
3.11
-3.923
-55.77%
Ranking of countries by current statistics by years