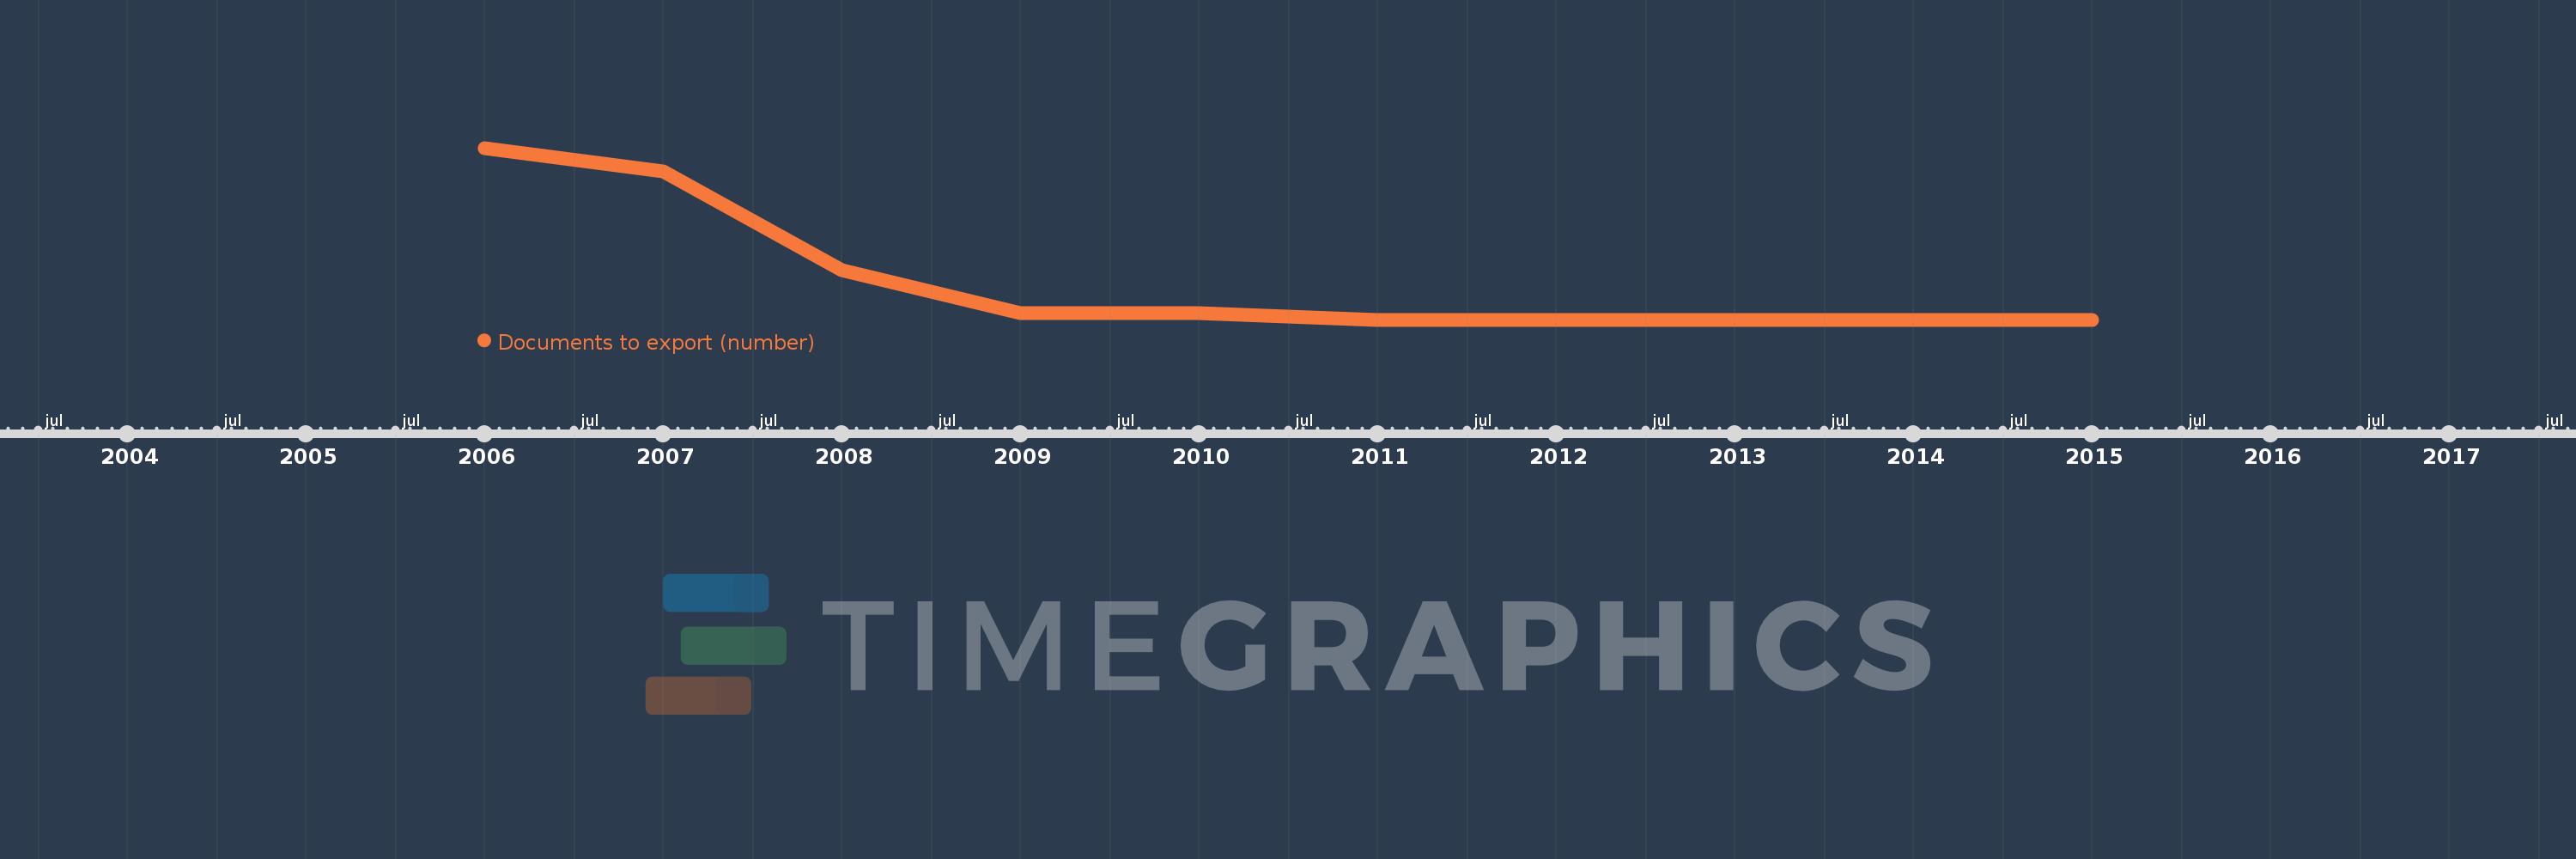
This timeline shows a graph from 2006 to 2015 of Heavily indebted poor countries (HIPC). No data until 2005. Number of actual observations by date: 10.
Source name:
World Development Indicators
Source organization:
World Bank, Doing Business project (http://www.doingbusiness.org/).
Categories, topics:
Private Sector, Trade
Last updated:
apr 23, 2017
Indicators value changes by year
Meaning:
7.774
Minimum:
7.632
jan 1, 2011
Maximum:
8.27
jan 1, 2006
At the date of observation
Value
Absolute change
Change from the previous value
jan 1, 2006
8.27
+8.27
0.0%
jan 1, 2007
8.184
-0.086
-1.04%
jan 1, 2008
7.816
-0.368
-4.5%
jan 1, 2009
7.658
-0.158
-2.02%
jan 1, 2010
7.658
0.0
0.0%
jan 1, 2011
7.632
-0.026
-0.34%
jan 1, 2012
7.632
0.0
0.0%
jan 1, 2013
7.632
0.0
0.0%
jan 1, 2014
7.632
0.0
0.0%
jan 1, 2015
7.632
0.0
0.0%
Ranking of countries by current statistics by years