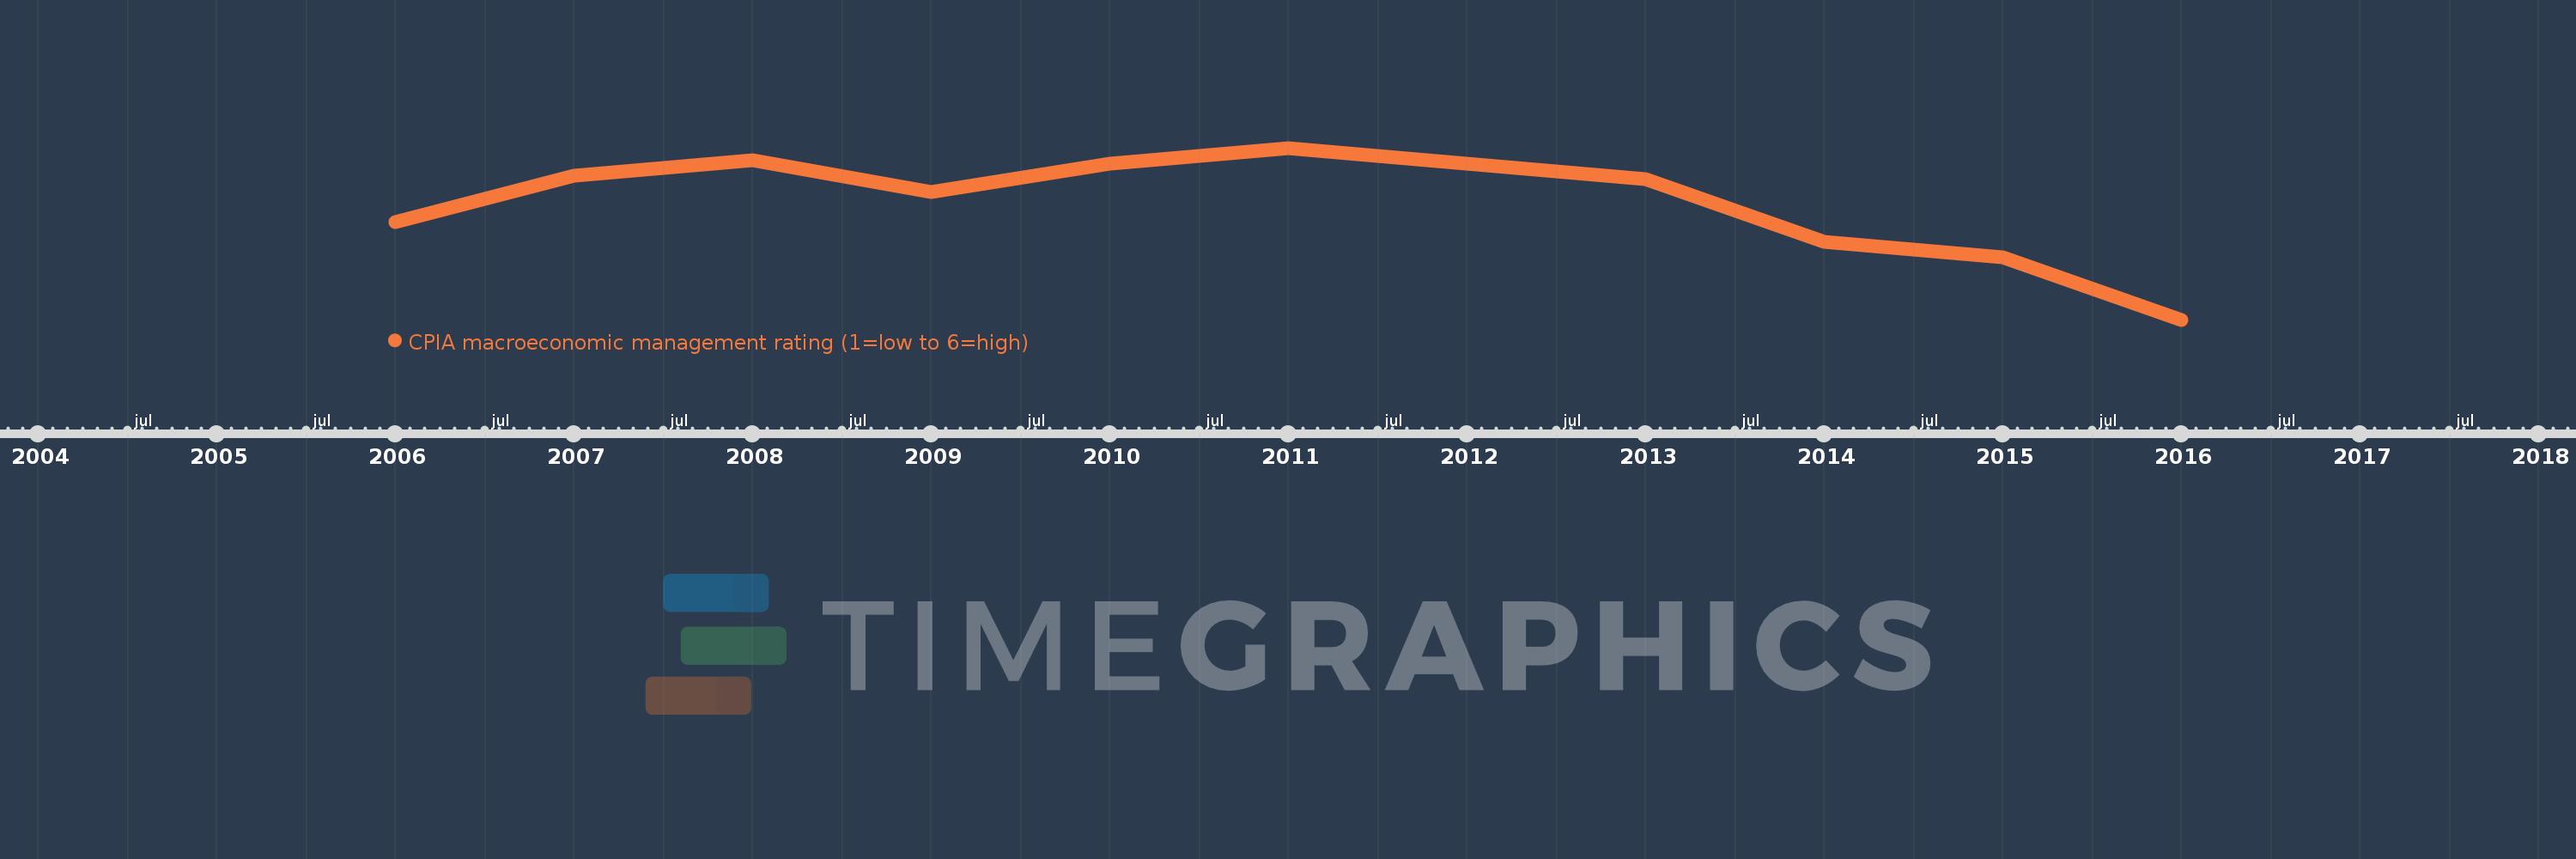
This timeline shows a graph from 2006 to 2016 of Heavily indebted poor countries (HIPC). No data until 2005. Number of actual observations by date: 11.
Source name:
World Development Indicators
Source organization:
World Bank Group, CPIA database (http://www.worldbank.org/ida).
Categories, topics:
Public Sector
Last updated:
apr 23, 2017
Indicators value changes by year
Meaning:
3.573
Minimum:
3.474
jan 1, 2016
Maximum:
3.618
jan 1, 2011
At the date of observation
Value
Absolute change
Change from the previous value
jan 1, 2006
3.556
+3.556
0.0%
jan 1, 2007
3.595
+0.039
1.1%
jan 1, 2008
3.608
+0.014
0.38%
jan 1, 2009
3.581
-0.027
-0.75%
jan 1, 2010
3.605
+0.024
0.68%
jan 1, 2011
3.618
+0.013
0.36%
jan 1, 2012
3.605
-0.013
-0.36%
jan 1, 2013
3.592
-0.013
-0.36%
jan 1, 2014
3.539
-0.053
-1.47%
jan 1, 2015
3.526
-0.013
-0.37%
jan 1, 2016
3.474
-0.053
-1.49%
Ranking of countries by current statistics by years