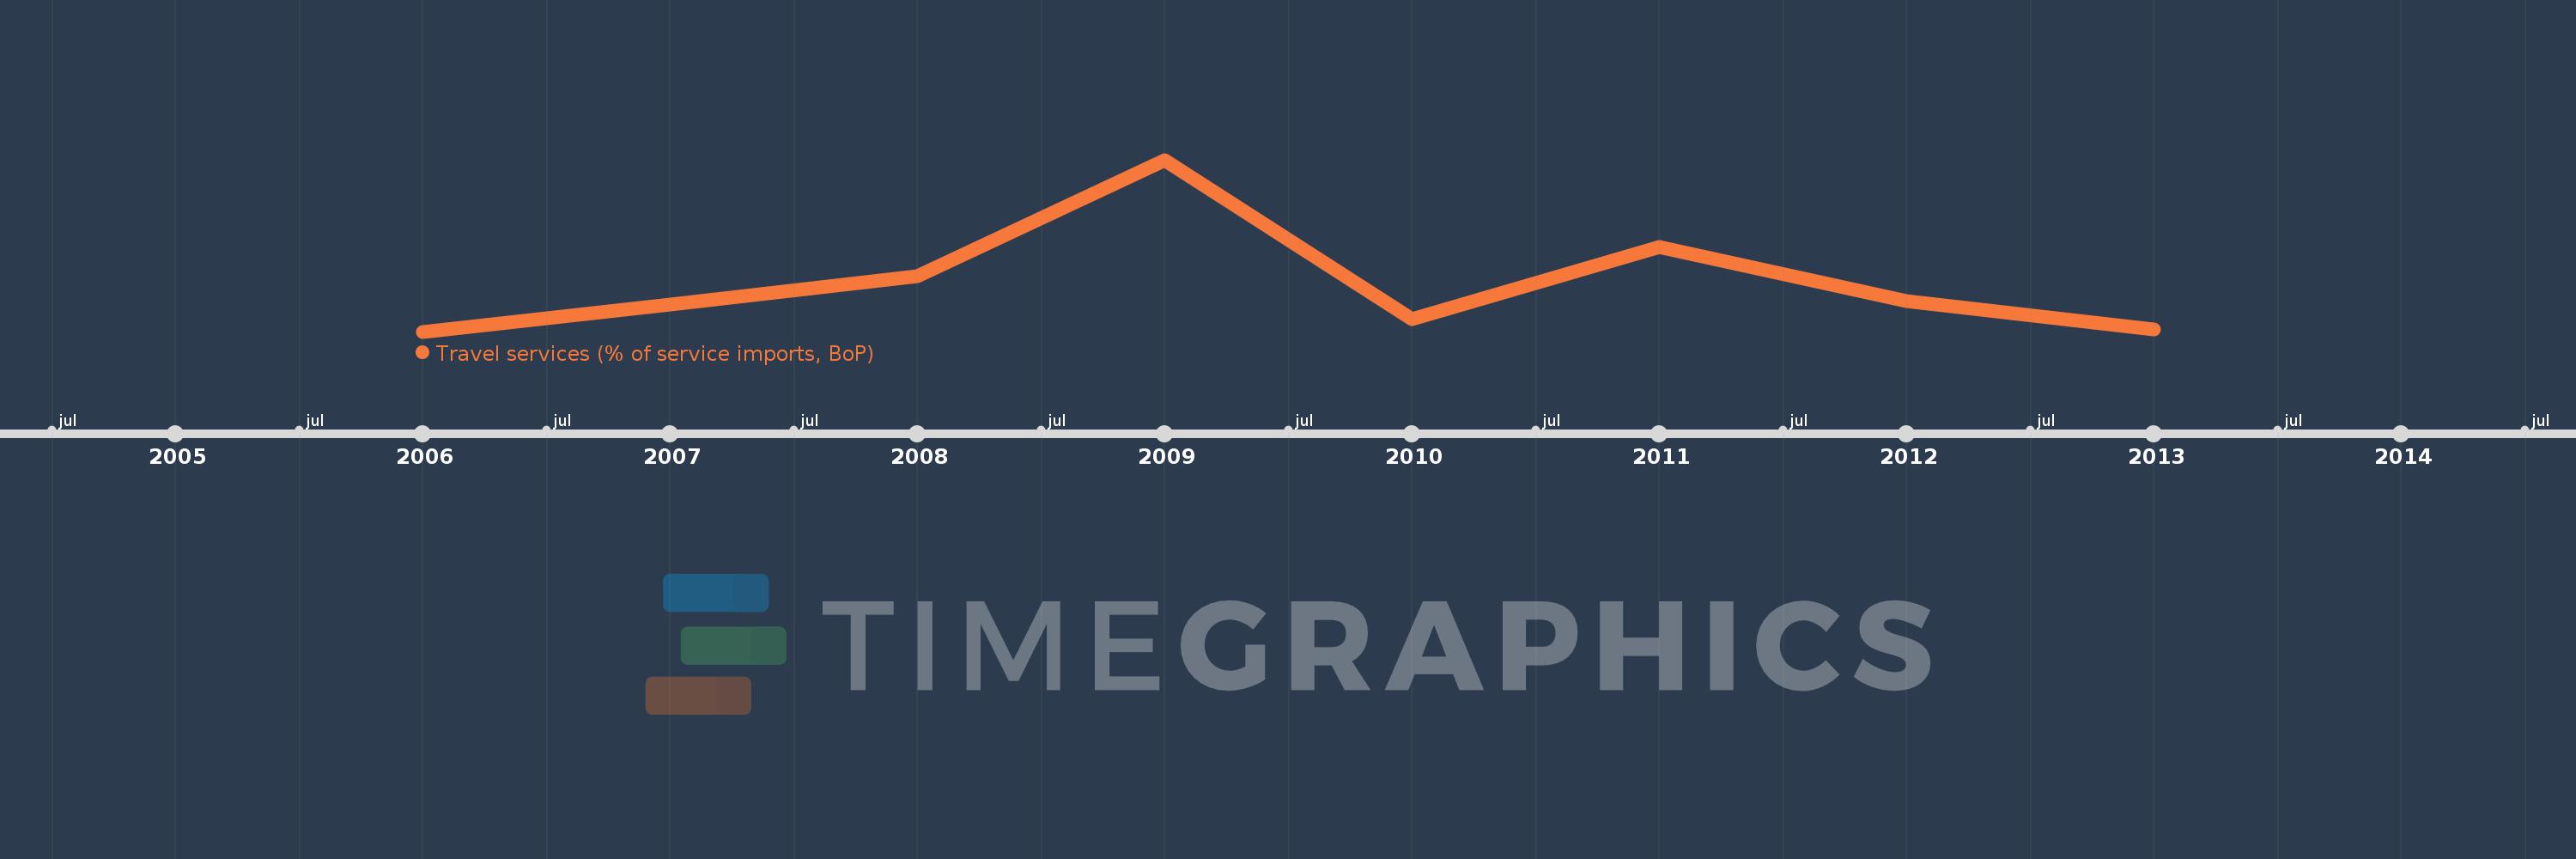
This timeline shows a graph from 2006 to 2013 of Fragile and conflict affected situations. No data until 2005. Number of actual observations by date: 8.
Source name:
World Development Indicators
Source organization:
International Monetary Fund, Balance of Payments Statistics Yearbook and data files.
Categories, topics:
Economy & Growth, Trade
Last updated:
apr 23, 2017
Indicators value changes by year
Meaning:
22.262
Minimum:
21.208
jan 1, 2006
Maximum:
24.974
jan 1, 2009
At the date of observation
Value
Absolute change
Change from the previous value
jan 1, 2006
21.208
+21.208
0.0%
jan 1, 2007
21.81
+0.602
2.84%
jan 1, 2008
22.421
+0.611
2.8%
jan 1, 2009
24.974
+2.553
11.39%
jan 1, 2010
21.482
-3.492
-13.98%
jan 1, 2011
23.071
+1.589
7.4%
jan 1, 2012
21.879
-1.192
-5.16%
jan 1, 2013
21.247
-0.632
-2.89%
Ranking of countries by current statistics by years