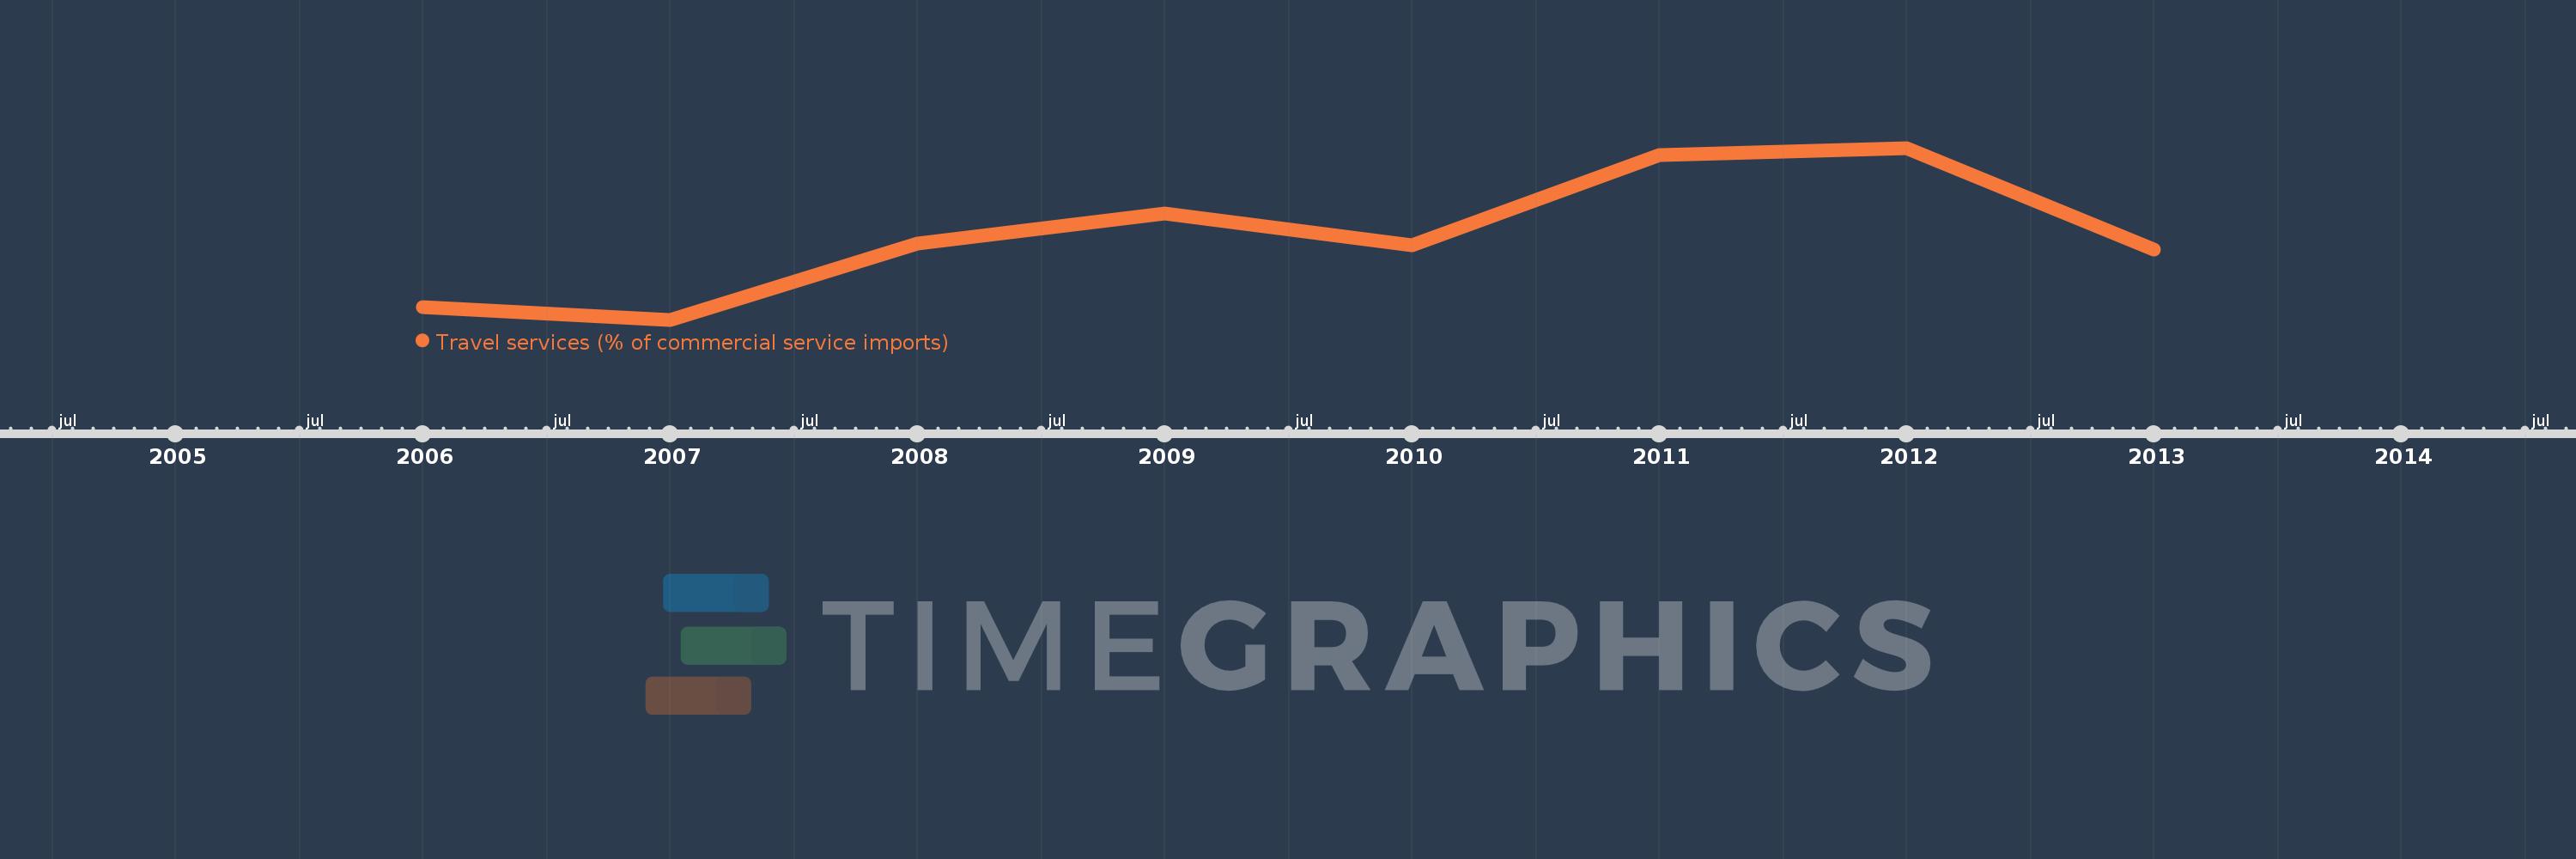
This timeline shows a graph from 2006 to 2013 of Fragile and conflict affected situations. No data until 2005. Number of actual observations by date: 8.
Source name:
World Development Indicators
Source organization:
International Monetary Fund, Balance of Payments Statistics Yearbook and data files.
Categories, topics:
Private Sector, Trade
Last updated:
apr 23, 2017
Indicators value changes by year
Meaning:
22.426
Minimum:
20.133
jan 1, 2007
Maximum:
24.796
jan 1, 2012
At the date of observation
Value
Absolute change
Change from the previous value
jan 1, 2006
20.467
+20.467
0.0%
jan 1, 2007
20.133
-0.334
-1.63%
jan 1, 2008
22.196
+2.063
10.25%
jan 1, 2009
23.022
+0.826
3.72%
jan 1, 2010
22.15
-0.872
-3.79%
jan 1, 2011
24.595
+2.445
11.04%
jan 1, 2012
24.796
+0.201
0.82%
jan 1, 2013
22.044
-2.752
-11.1%
Ranking of countries by current statistics by years