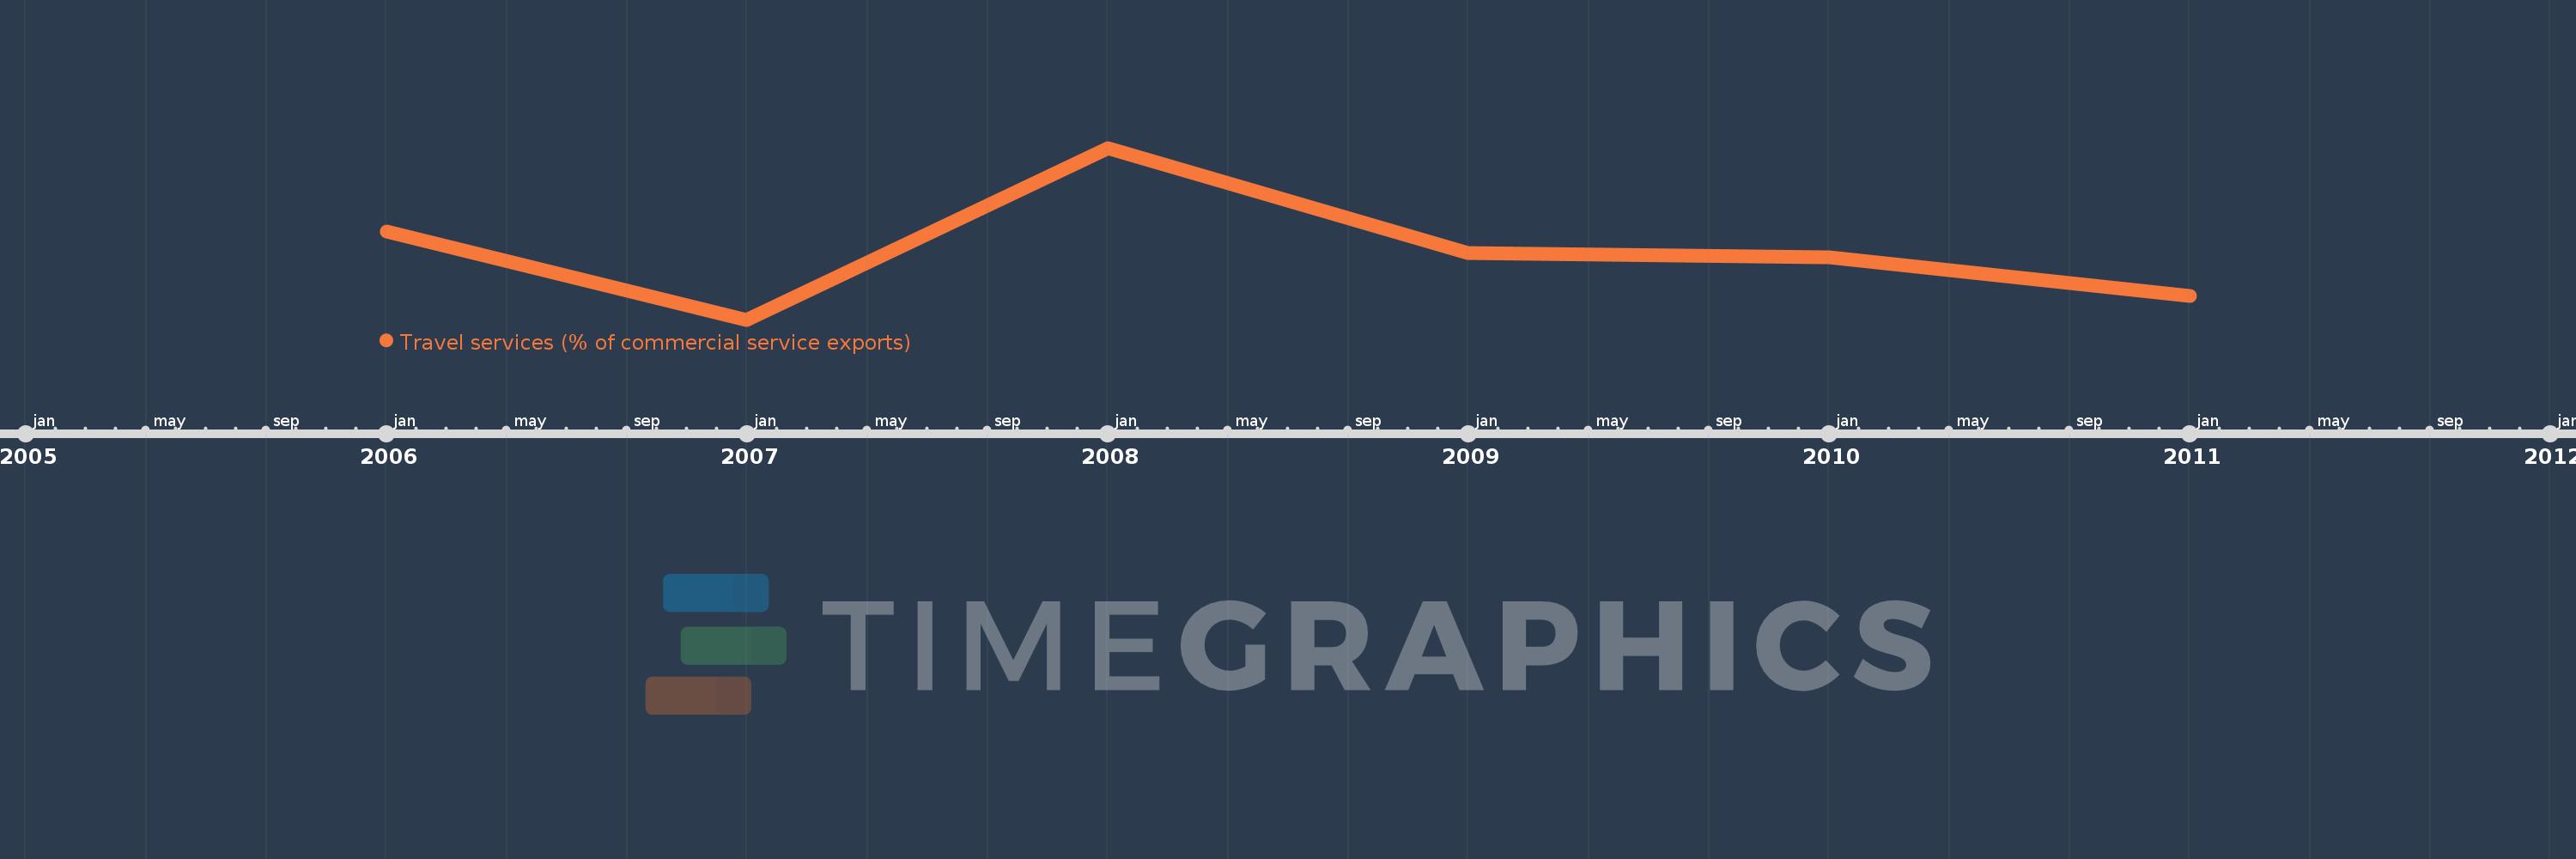
This timeline shows a graph from 2006 to 2011 of Fragile and conflict affected situations. No data until 2005. Number of actual observations by date: 6.
Source name:
World Development Indicators
Source organization:
International Monetary Fund, Balance of Payments Statistics Yearbook and data files.
Categories, topics:
Private Sector, Trade
Last updated:
apr 23, 2017
Indicators value changes by year
Meaning:
48.482
Minimum:
42.84
jan 1, 2007
Maximum:
56.912
jan 1, 2008
At the date of observation
Value
Absolute change
Change from the previous value
jan 1, 2006
50.061
+50.061
0.0%
jan 1, 2007
42.84
-7.22
-14.42%
jan 1, 2008
56.912
+14.071
32.85%
jan 1, 2009
48.302
-8.61
-15.13%
jan 1, 2010
47.956
-0.346
-0.72%
jan 1, 2011
44.82
-3.136
-6.54%
Ranking of countries by current statistics by years