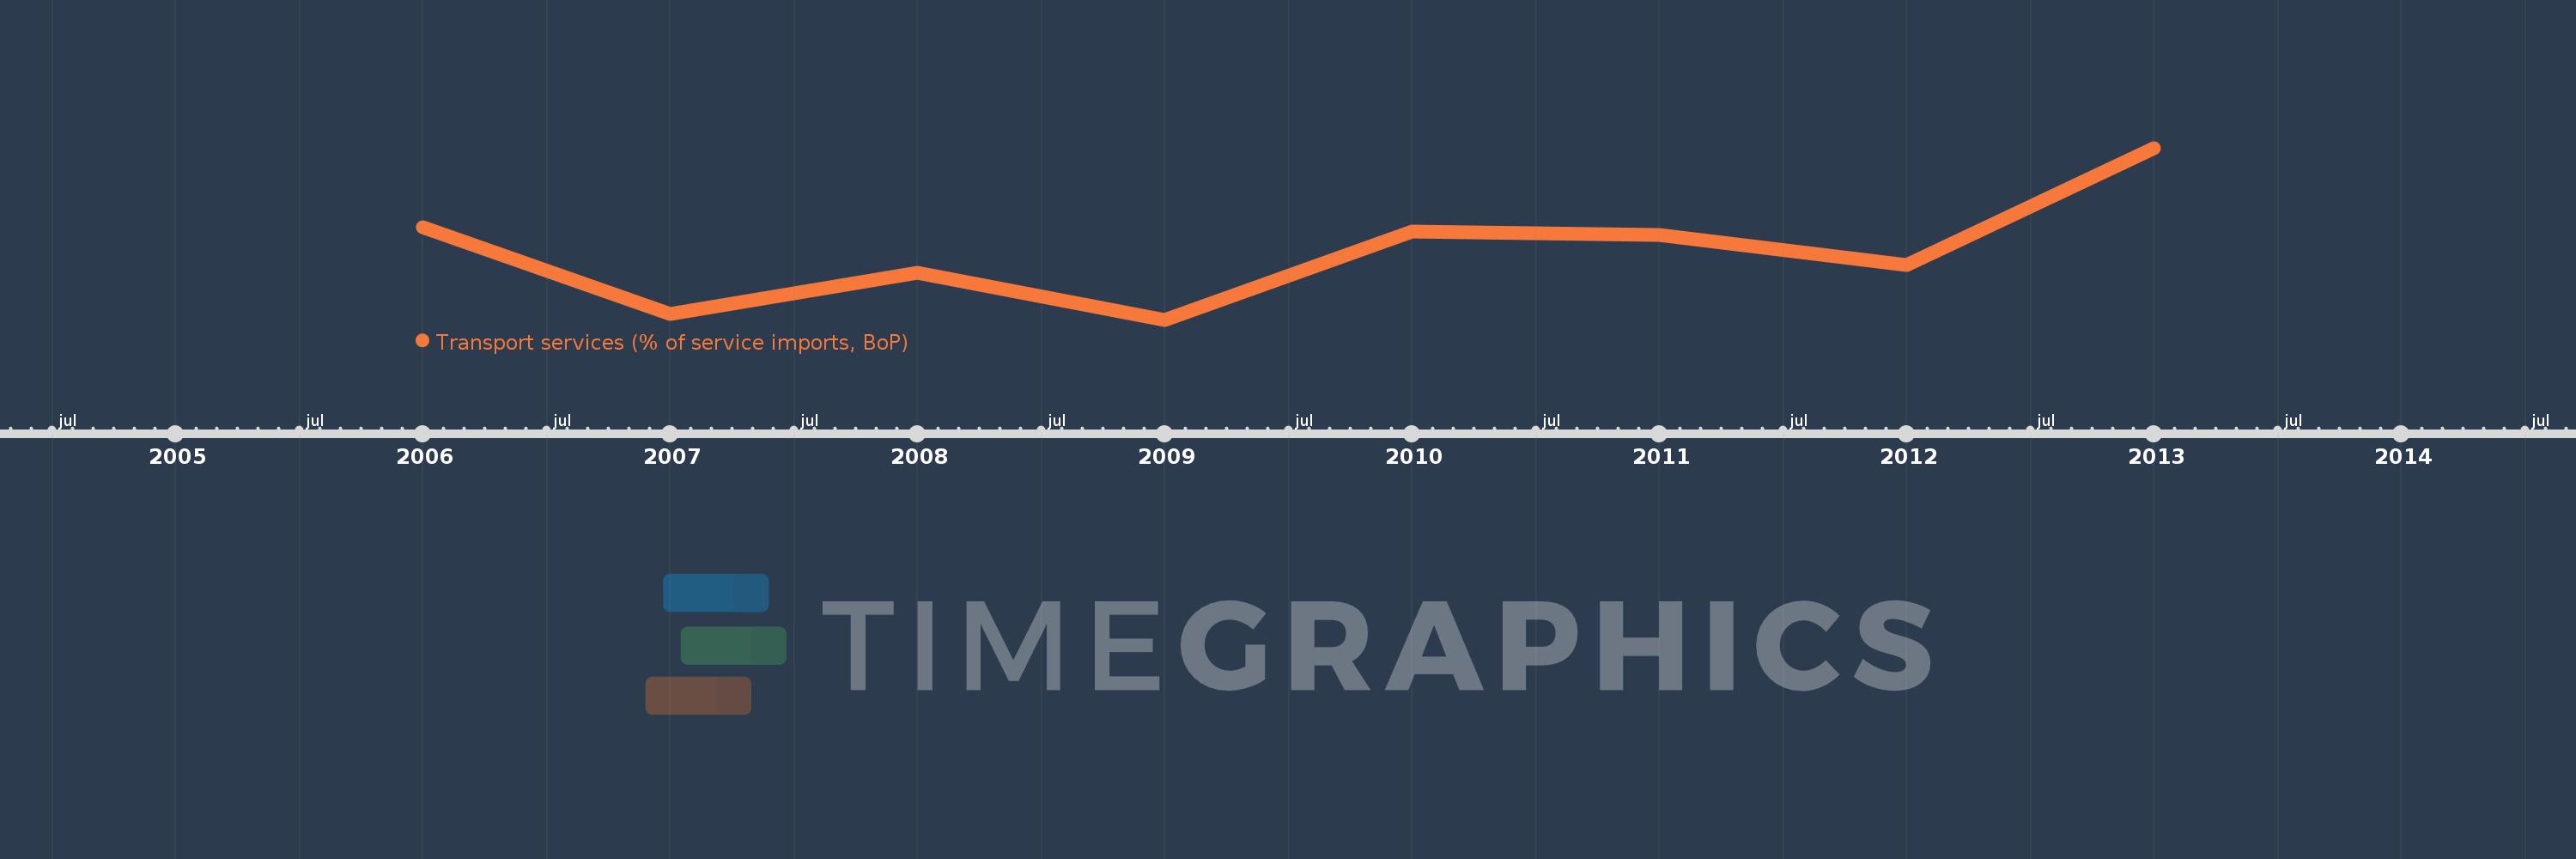
This timeline shows a graph from 2006 to 2013 of Fragile and conflict affected situations. No data until 2005. Number of actual observations by date: 8.
Source name:
World Development Indicators
Source organization:
International Monetary Fund, Balance of Payments Statistics Yearbook and data files.
Categories, topics:
Economy & Growth, Trade
Last updated:
apr 23, 2017
Indicators value changes by year
Meaning:
36.787
Minimum:
34.593
jan 1, 2009
Maximum:
40.123
jan 1, 2013
At the date of observation
Value
Absolute change
Change from the previous value
jan 1, 2006
37.583
+37.583
0.0%
jan 1, 2007
34.782
-2.8
-7.45%
jan 1, 2008
36.114
+1.332
3.83%
jan 1, 2009
34.593
-1.522
-4.21%
jan 1, 2010
37.423
+2.831
8.18%
jan 1, 2011
37.332
-0.091
-0.24%
jan 1, 2012
36.343
-0.989
-2.65%
jan 1, 2013
40.123
+3.779
10.4%
Ranking of countries by current statistics by years