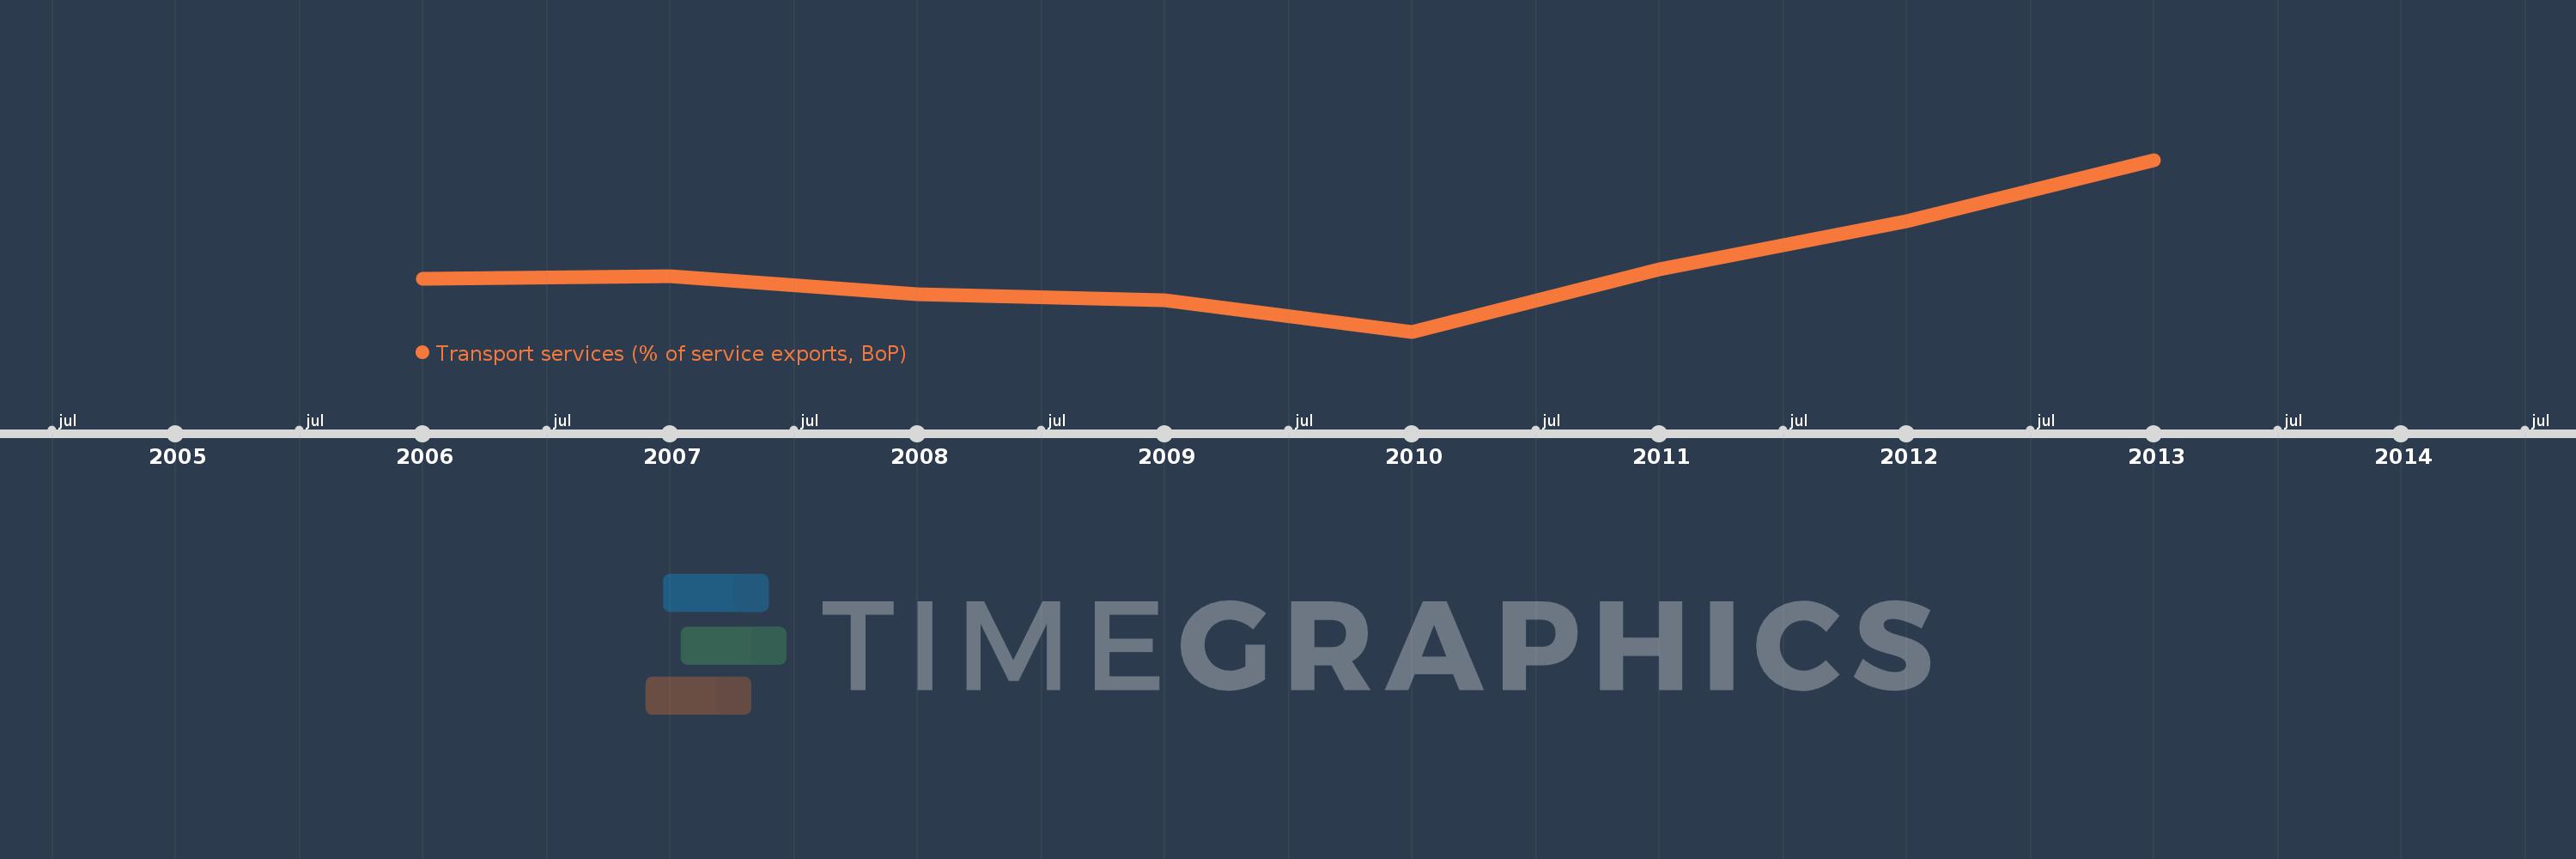
This timeline shows a graph from 2006 to 2013 of Fragile and conflict affected situations. No data until 2005. Number of actual observations by date: 8.
Source name:
World Development Indicators
Source organization:
International Monetary Fund, Balance of Payments Statistics Yearbook and data files.
Categories, topics:
Economy & Growth, Trade
Last updated:
apr 23, 2017
Indicators value changes by year
Meaning:
9.638
Minimum:
7.521
jan 1, 2010
Maximum:
13.092
jan 1, 2013
At the date of observation
Value
Absolute change
Change from the previous value
jan 1, 2006
9.234
+9.234
0.0%
jan 1, 2007
9.321
+0.087
0.94%
jan 1, 2008
8.742
-0.579
-6.21%
jan 1, 2009
8.533
-0.209
-2.39%
jan 1, 2010
7.521
-1.012
-11.86%
jan 1, 2011
9.554
+2.032
27.02%
jan 1, 2012
11.109
+1.556
16.28%
jan 1, 2013
13.092
+1.983
17.85%
Ranking of countries by current statistics by years