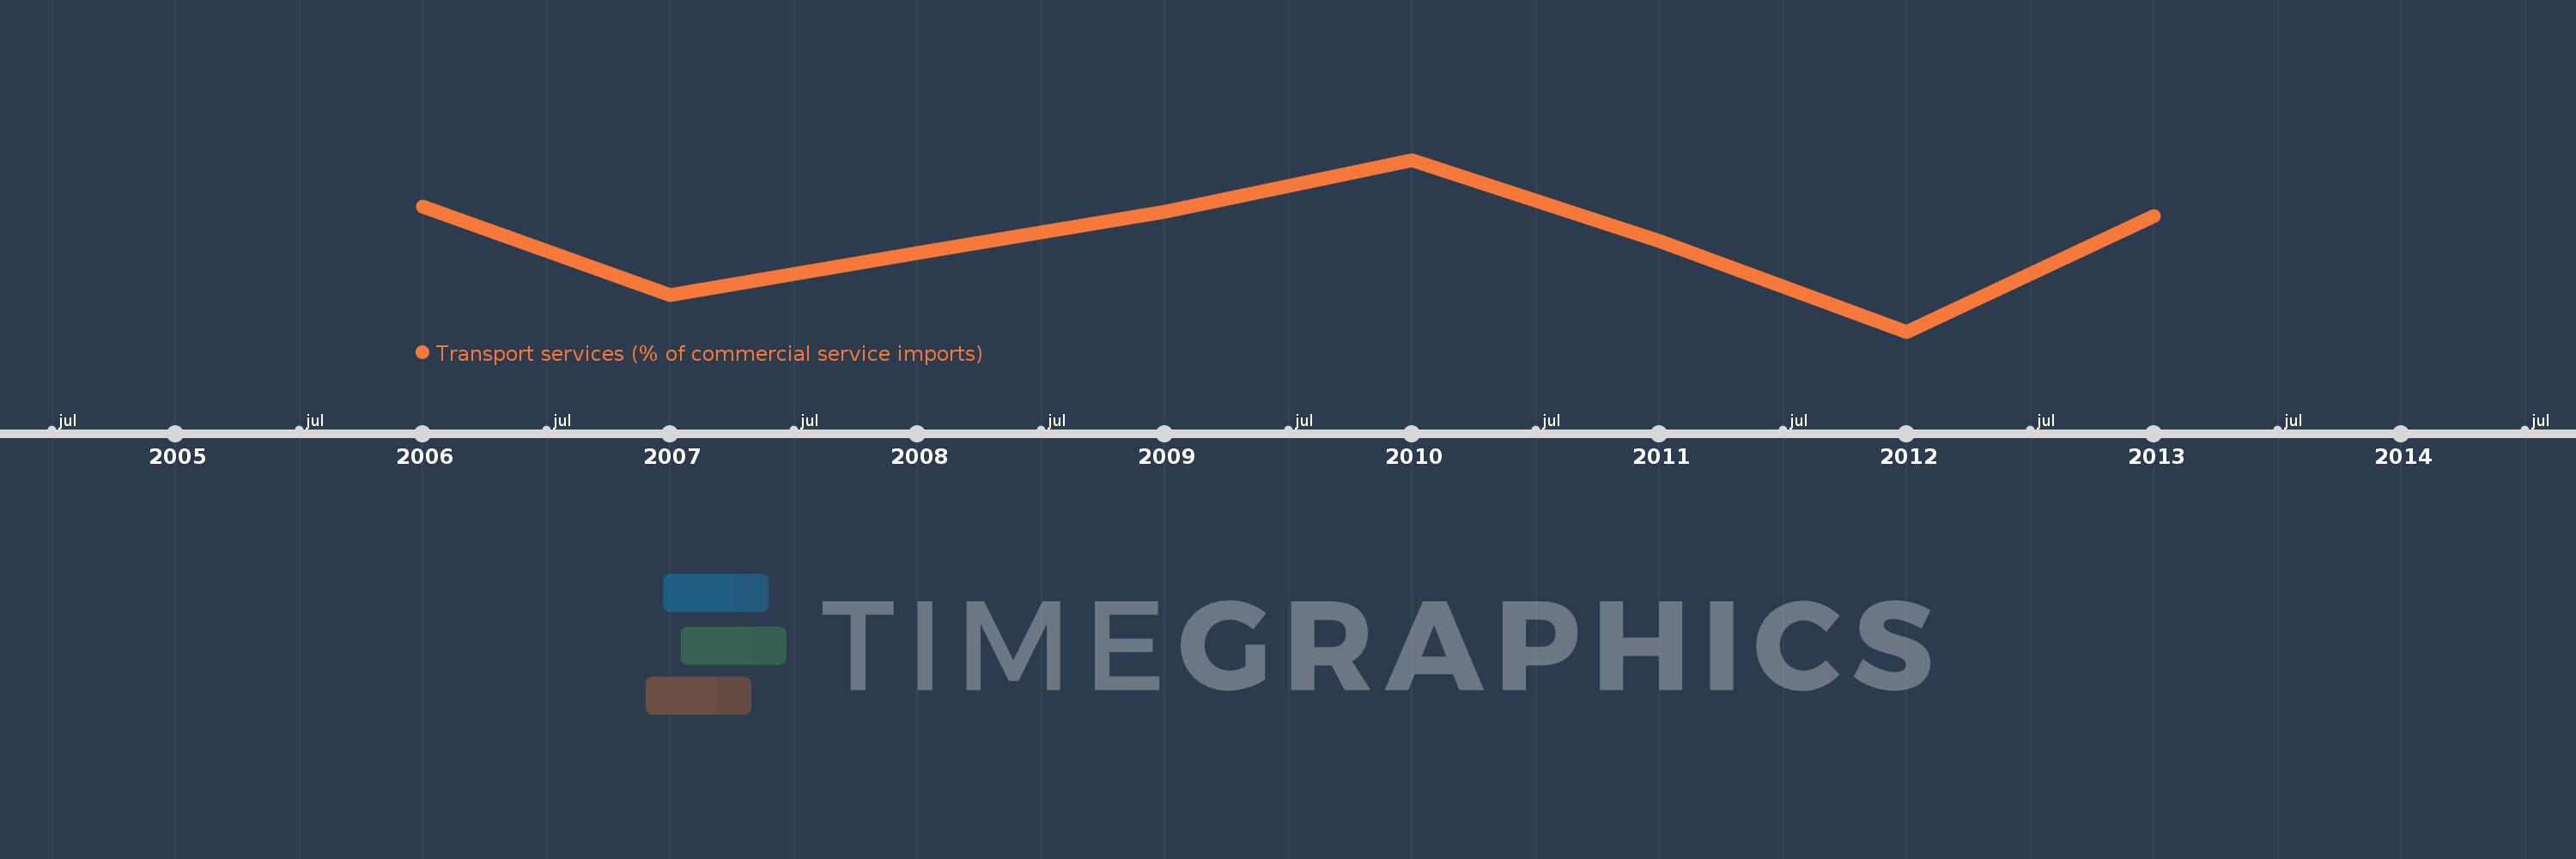
This timeline shows a graph from 2006 to 2013 of Fragile and conflict affected situations. No data until 2005. Number of actual observations by date: 8.
Source name:
World Development Indicators
Source organization:
International Monetary Fund, Balance of Payments Statistics Yearbook and data files.
Categories, topics:
Private Sector, Trade
Last updated:
apr 23, 2017
Indicators value changes by year
Meaning:
45.286
Minimum:
42.535
jan 1, 2012
Maximum:
47.663
jan 1, 2010
At the date of observation
Value
Absolute change
Change from the previous value
jan 1, 2006
46.27
+46.27
0.0%
jan 1, 2007
43.616
-2.654
-5.74%
jan 1, 2008
44.887
+1.271
2.91%
jan 1, 2009
46.1
+1.213
2.7%
jan 1, 2010
47.663
+1.563
3.39%
jan 1, 2011
45.246
-2.417
-5.07%
jan 1, 2012
42.535
-2.711
-5.99%
jan 1, 2013
45.974
+3.439
8.09%
Ranking of countries by current statistics by years