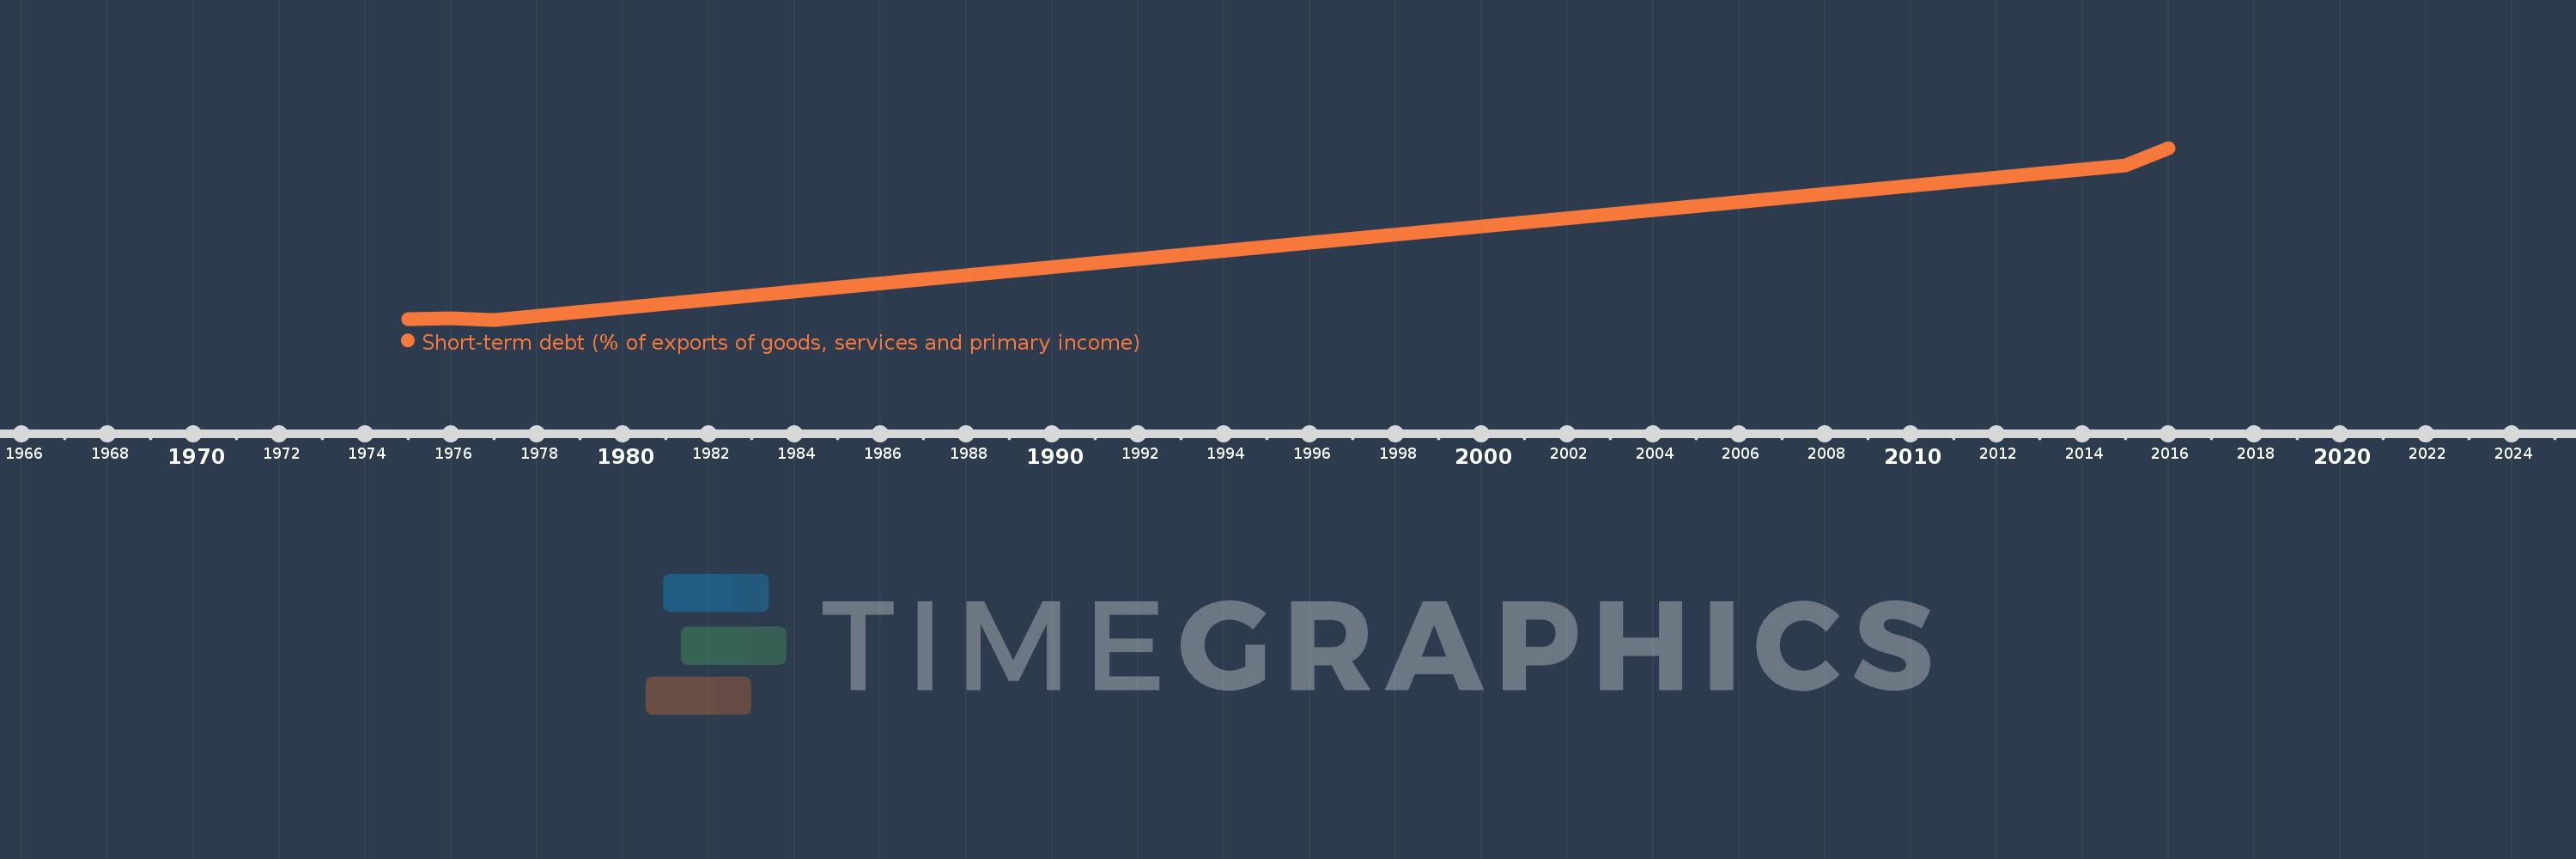
This timeline shows a graph from 1975 to 2016 of Fragile and conflict affected situations. No data until 1974. Number of actual observations by date: 5.
Source name:
World Development Indicators
Source organization:
World Bank, International Debt Statistics.
Categories, topics:
Economy & Growth, External Debt
Last updated:
apr 23, 2017
Indicators value changes by year
Meaning:
7.351
Minimum:
0.041
jan 1, 1977
Maximum:
19.18
jan 1, 2016
At the date of observation
Value
Absolute change
Change from the previous value
jan 1, 1975
0.074
+0.074
0.0%
jan 1, 1976
0.187
+0.112
150.8%
jan 1, 1977
0.041
-0.146
-78.0%
jan 1, 2015
17.274
+17.233
41.94K%
jan 1, 2016
19.18
+1.906
11.03%
Ranking of countries by current statistics by years