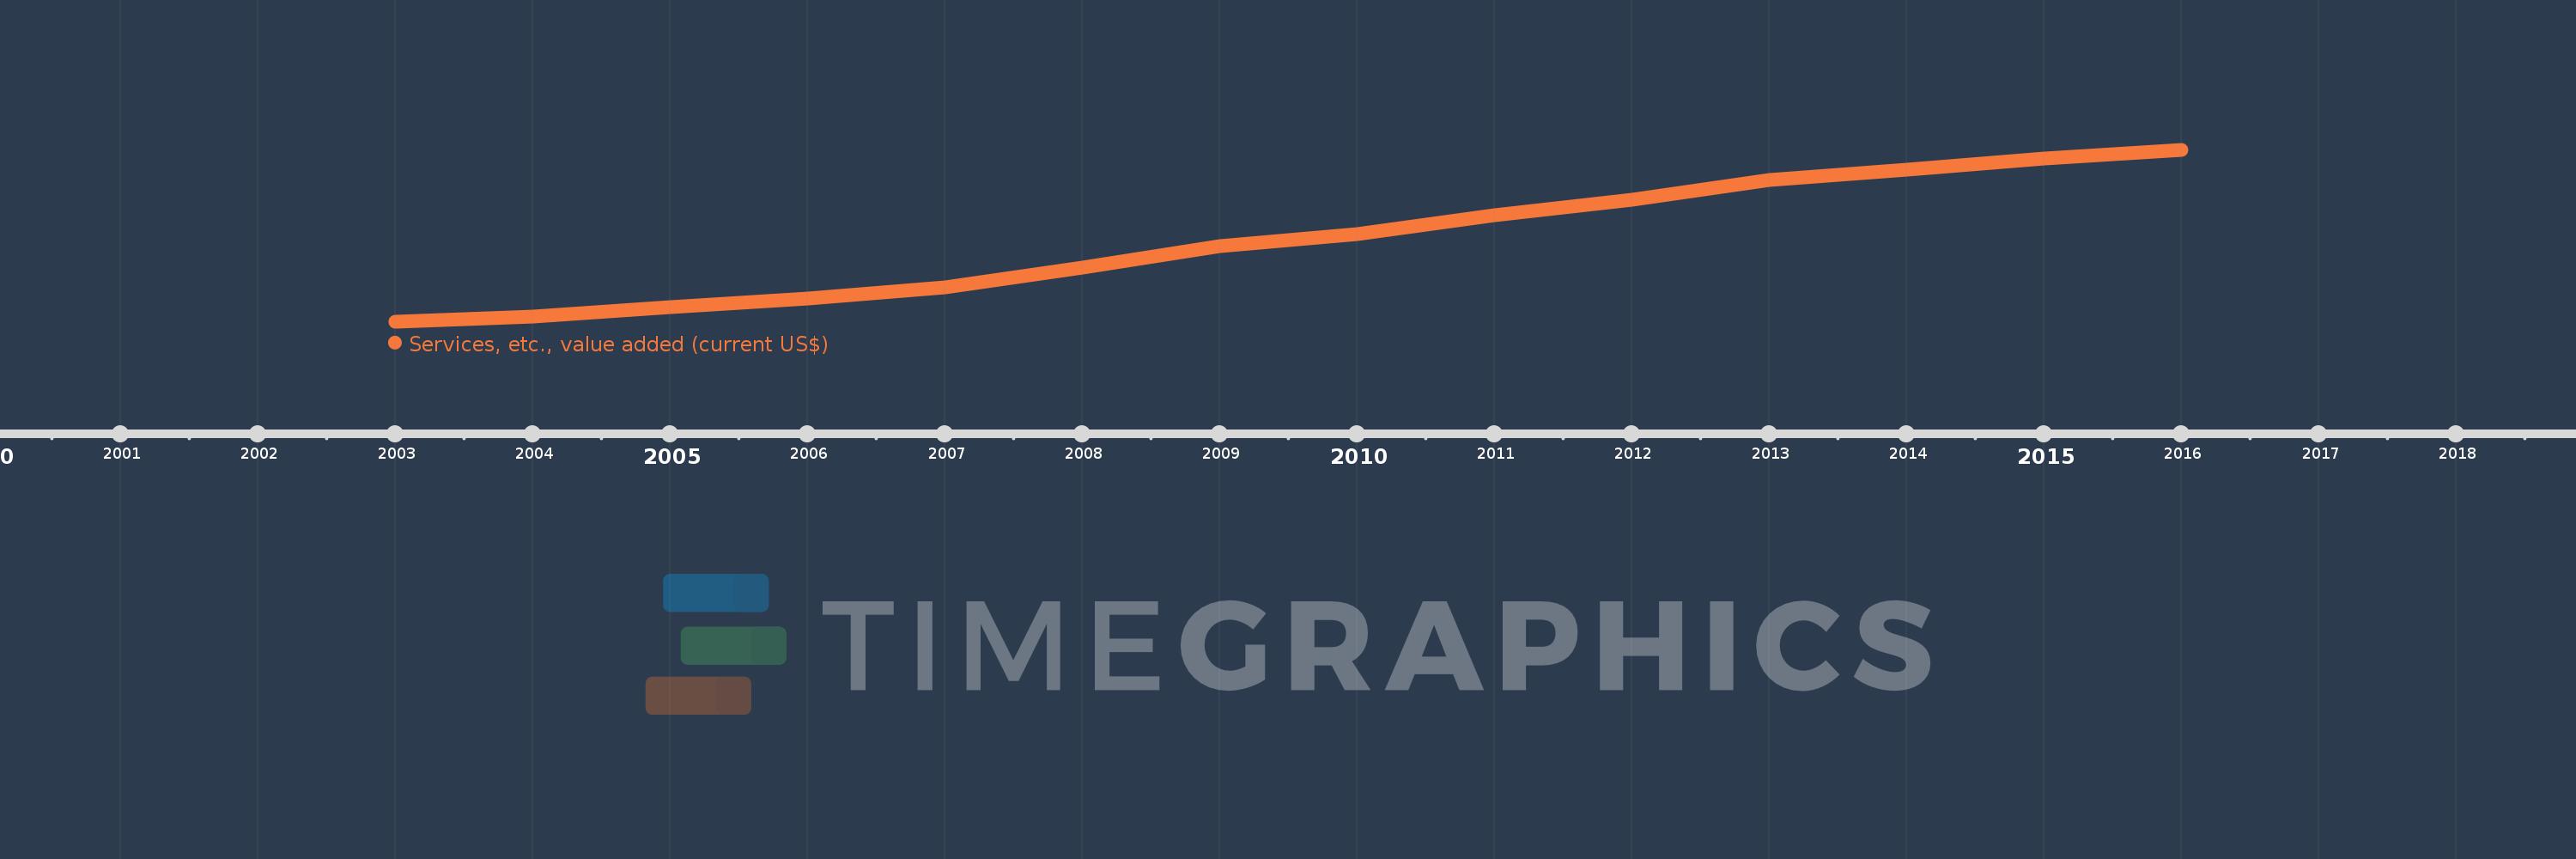
This timeline shows a graph from 2003 to 2016 of Fragile and conflict affected situations. No data until 2002. Number of actual observations by date: 14.
Source name:
World Development Indicators
Source organization:
World Bank national accounts data, and OECD National Accounts data files.
Categories, topics:
Economy & Growth
Last updated:
apr 23, 2017
Indicators value changes by year
Meaning:
225.396 bln
Minimum:
74.17 bln
jan 1, 2003
Maximum:
389.235 bln
jan 1, 2016
At the date of observation
Value
Absolute change
Change from the previous value
jan 1, 2003
74.17 bln
+74.17 bln
0.0%
jan 1, 2004
83.388 bln
+9.218 bln
12.43%
jan 1, 2005
101.292 bln
+17.904 bln
21.47%
jan 1, 2006
117.008 bln
+15.716 bln
15.52%
jan 1, 2007
137.745 bln
+20.737 bln
17.72%
jan 1, 2008
173.27 bln
+35.525 bln
25.79%
jan 1, 2009
212.992 bln
+39.721 bln
22.92%
jan 1, 2010
235.193 bln
+22.202 bln
10.42%
jan 1, 2011
269.9 bln
+34.706 bln
14.76%
jan 1, 2012
299.117 bln
+29.217 bln
10.83%
jan 1, 2013
334.322 bln
+35.205 bln
11.77%
jan 1, 2014
353.286 bln
+18.964 bln
5.67%
jan 1, 2015
374.623 bln
+21.337 bln
6.04%
jan 1, 2016
389.235 bln
+14.612 bln
3.9%
Ranking of countries by current statistics by years