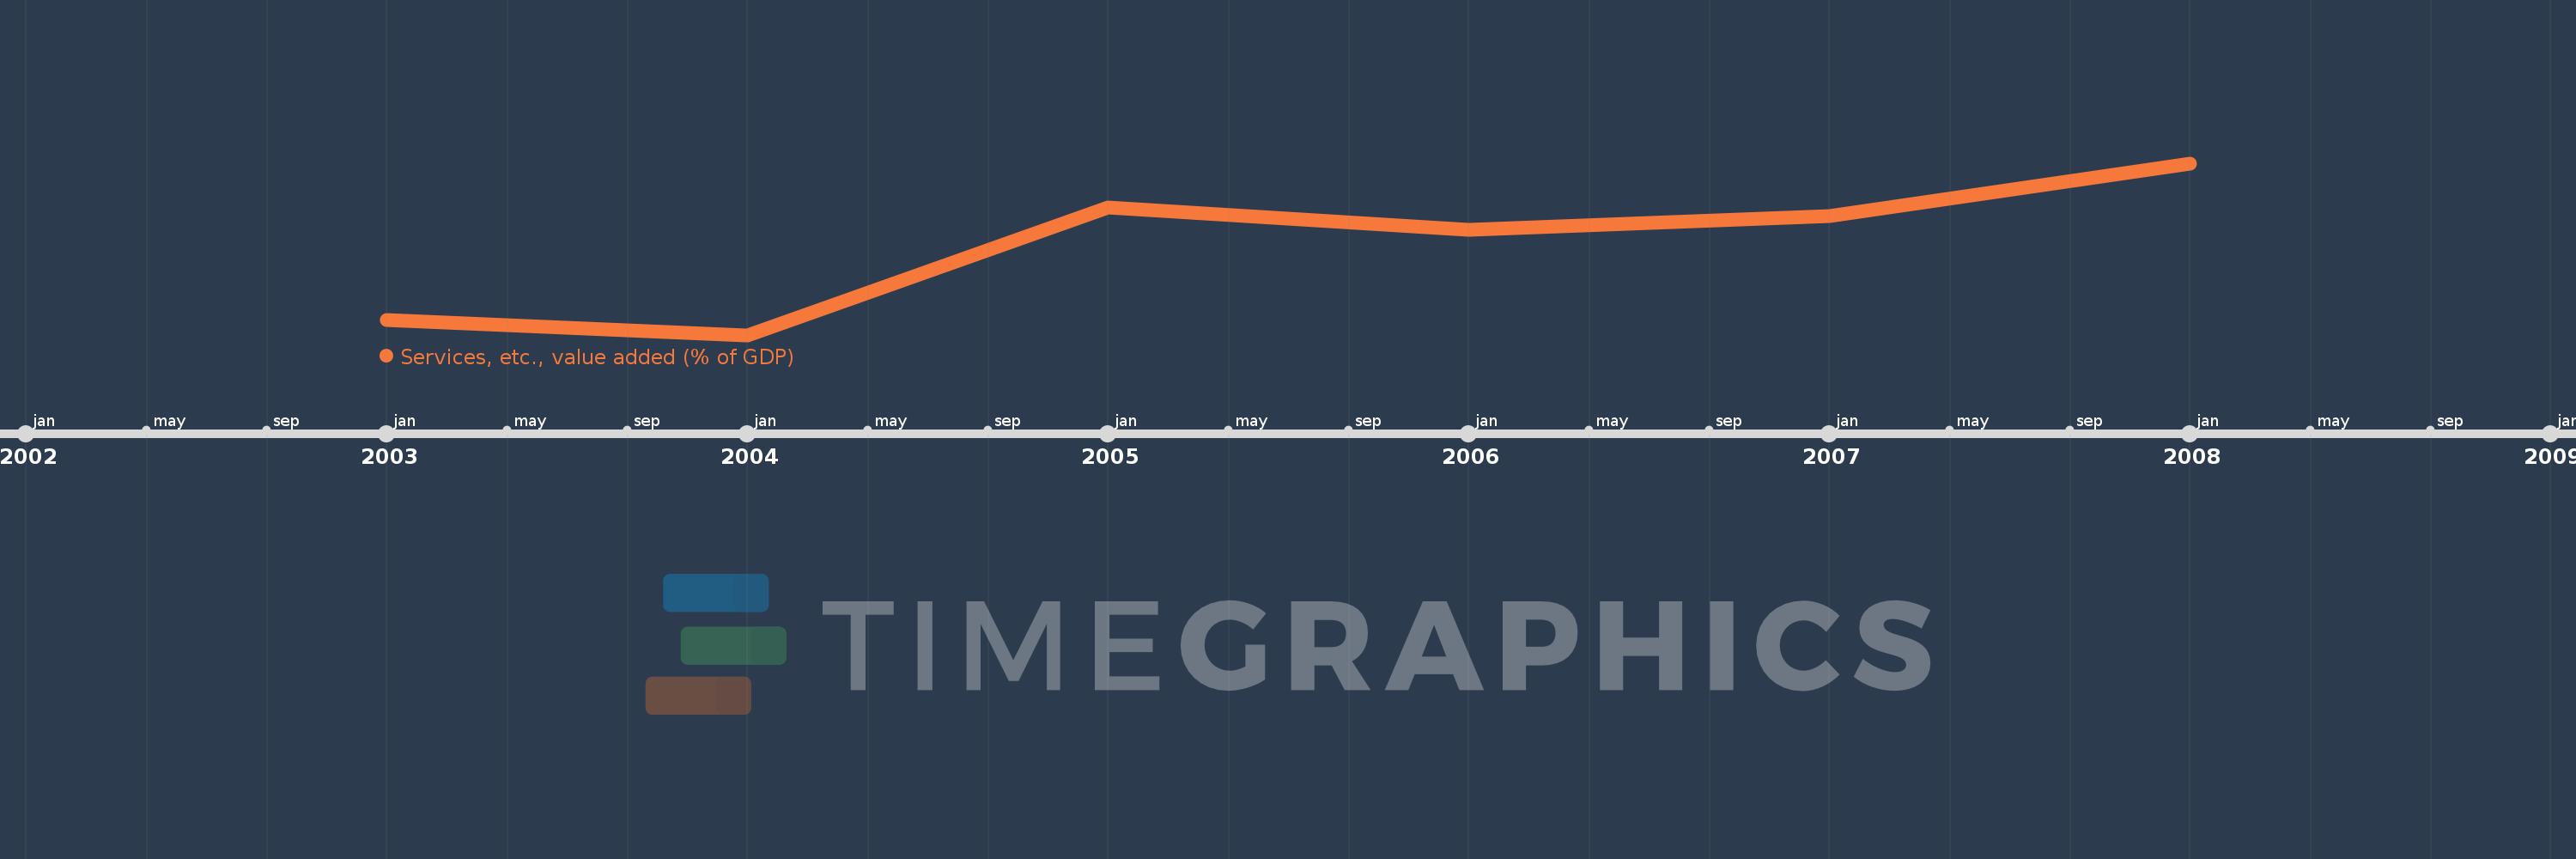
This timeline shows a graph from 2003 to 2008 of Fragile and conflict affected situations. No data until 2002. Number of actual observations by date: 6.
Source name:
World Development Indicators
Source organization:
World Bank national accounts data, and OECD National Accounts data files.
Categories, topics:
Economy & Growth
Last updated:
apr 23, 2017
Indicators value changes by year
Meaning:
41.839
Minimum:
40.369
jan 1, 2004
Maximum:
43.181
jan 1, 2008
At the date of observation
Value
Absolute change
Change from the previous value
jan 1, 2003
40.614
+40.614
0.0%
jan 1, 2004
40.369
-0.246
-0.61%
jan 1, 2005
42.453
+2.084
5.16%
jan 1, 2006
42.097
-0.356
-0.84%
jan 1, 2007
42.321
+0.224
0.53%
jan 1, 2008
43.181
+0.86
2.03%
Ranking of countries by current statistics by years