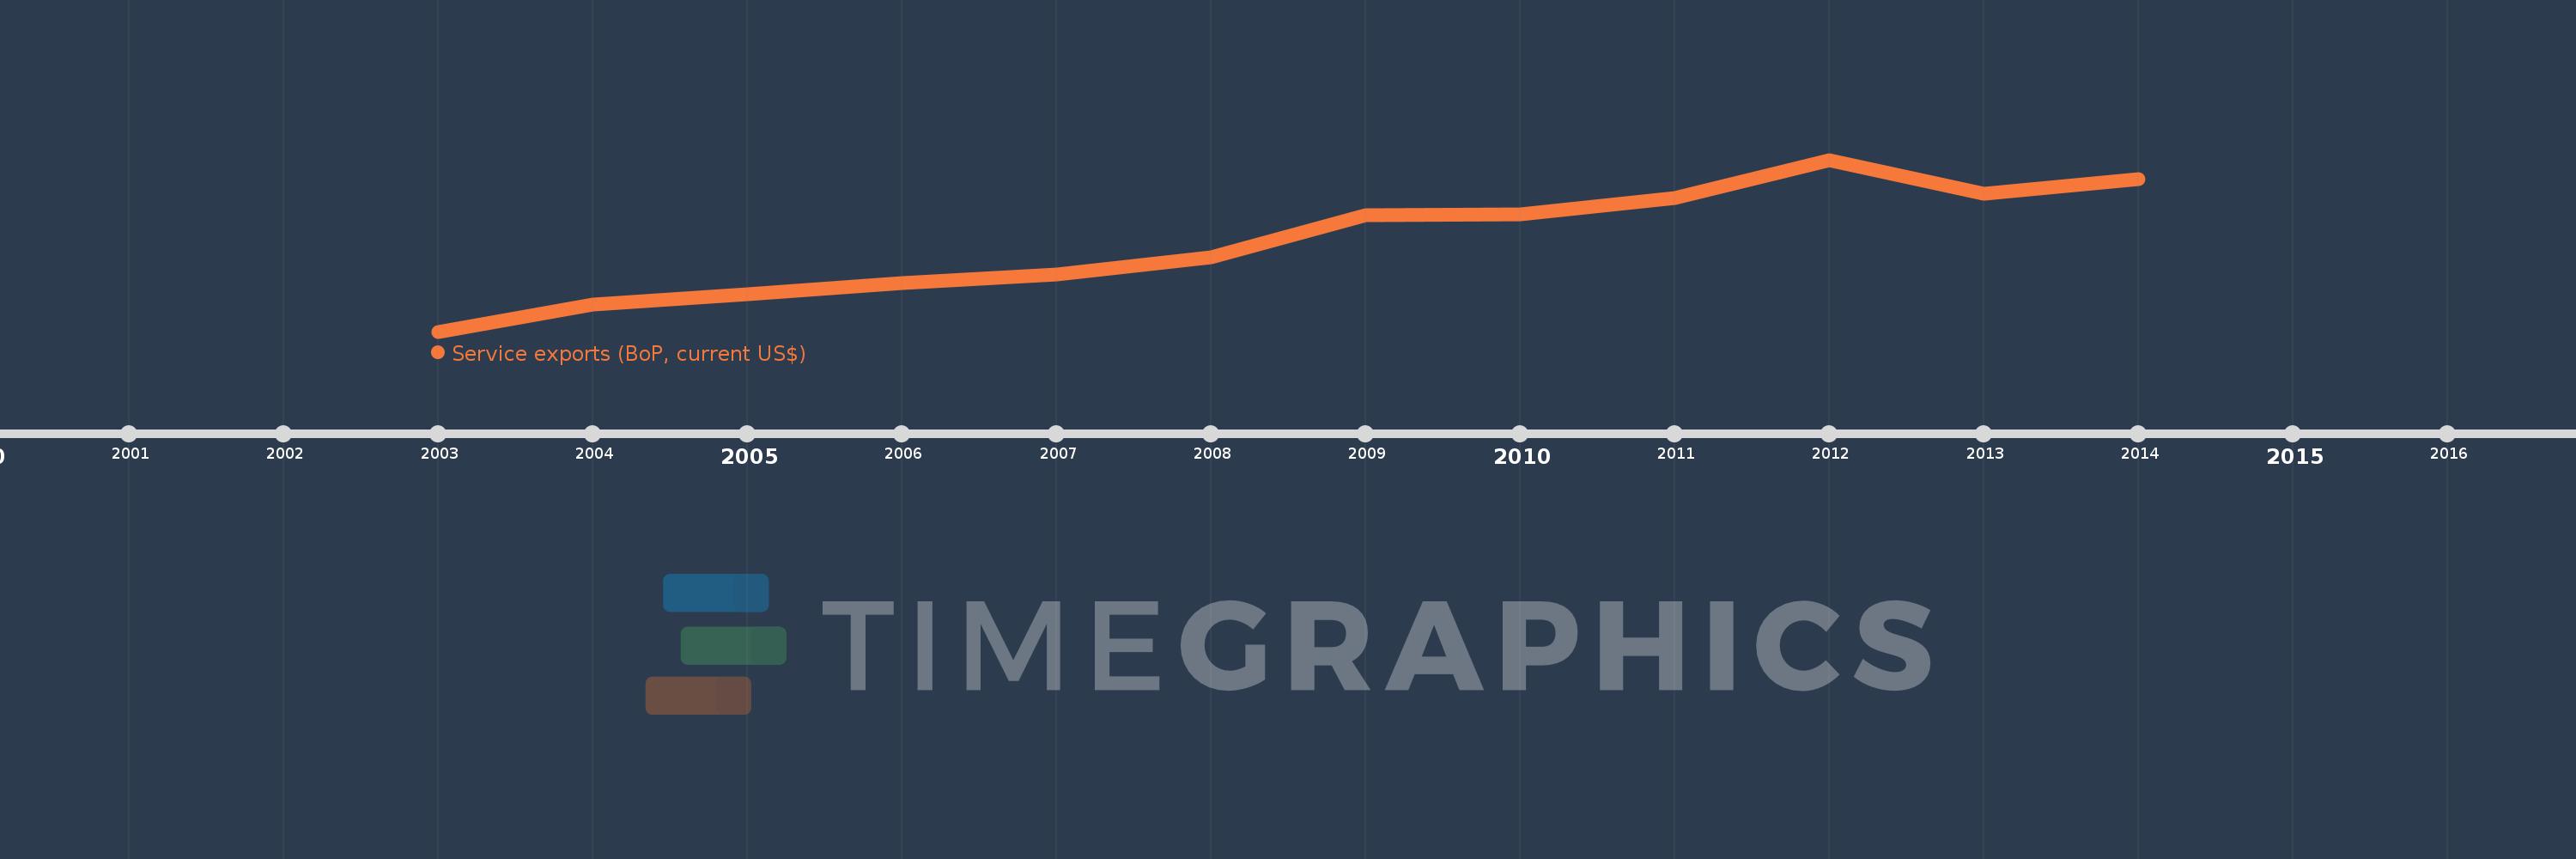
This timeline shows a graph from 2003 to 2014 of Fragile and conflict affected situations. No data until 2002. Number of actual observations by date: 12.
Source name:
World Development Indicators
Source organization:
International Monetary Fund, Balance of Payments Statistics Yearbook and data files.
Categories, topics:
Economy & Growth, Trade
Last updated:
apr 23, 2017
Indicators value changes by year
Meaning:
30.797 bln
Minimum:
11.167 bln
jan 1, 2003
Maximum:
48.84 bln
jan 1, 2012
At the date of observation
Value
Absolute change
Change from the previous value
jan 1, 2003
11.167 bln
+11.167 bln
0.0%
jan 1, 2004
17.184 bln
+6.017 bln
53.88%
jan 1, 2005
19.369 bln
+2.185 bln
12.72%
jan 1, 2006
21.836 bln
+2.466 bln
12.73%
jan 1, 2007
23.684 bln
+1.848 bln
8.47%
jan 1, 2008
27.52 bln
+3.836 bln
16.2%
jan 1, 2009
36.762 bln
+9.241 bln
33.58%
jan 1, 2010
36.858 bln
+96.397 mln
0.26%
jan 1, 2011
40.381 bln
+3.523 bln
9.56%
jan 1, 2012
48.84 bln
+8.459 bln
20.95%
jan 1, 2013
41.33 bln
-7.509 bln
-15.38%
jan 1, 2014
44.628 bln
+3.298 bln
7.98%
Ranking of countries by current statistics by years