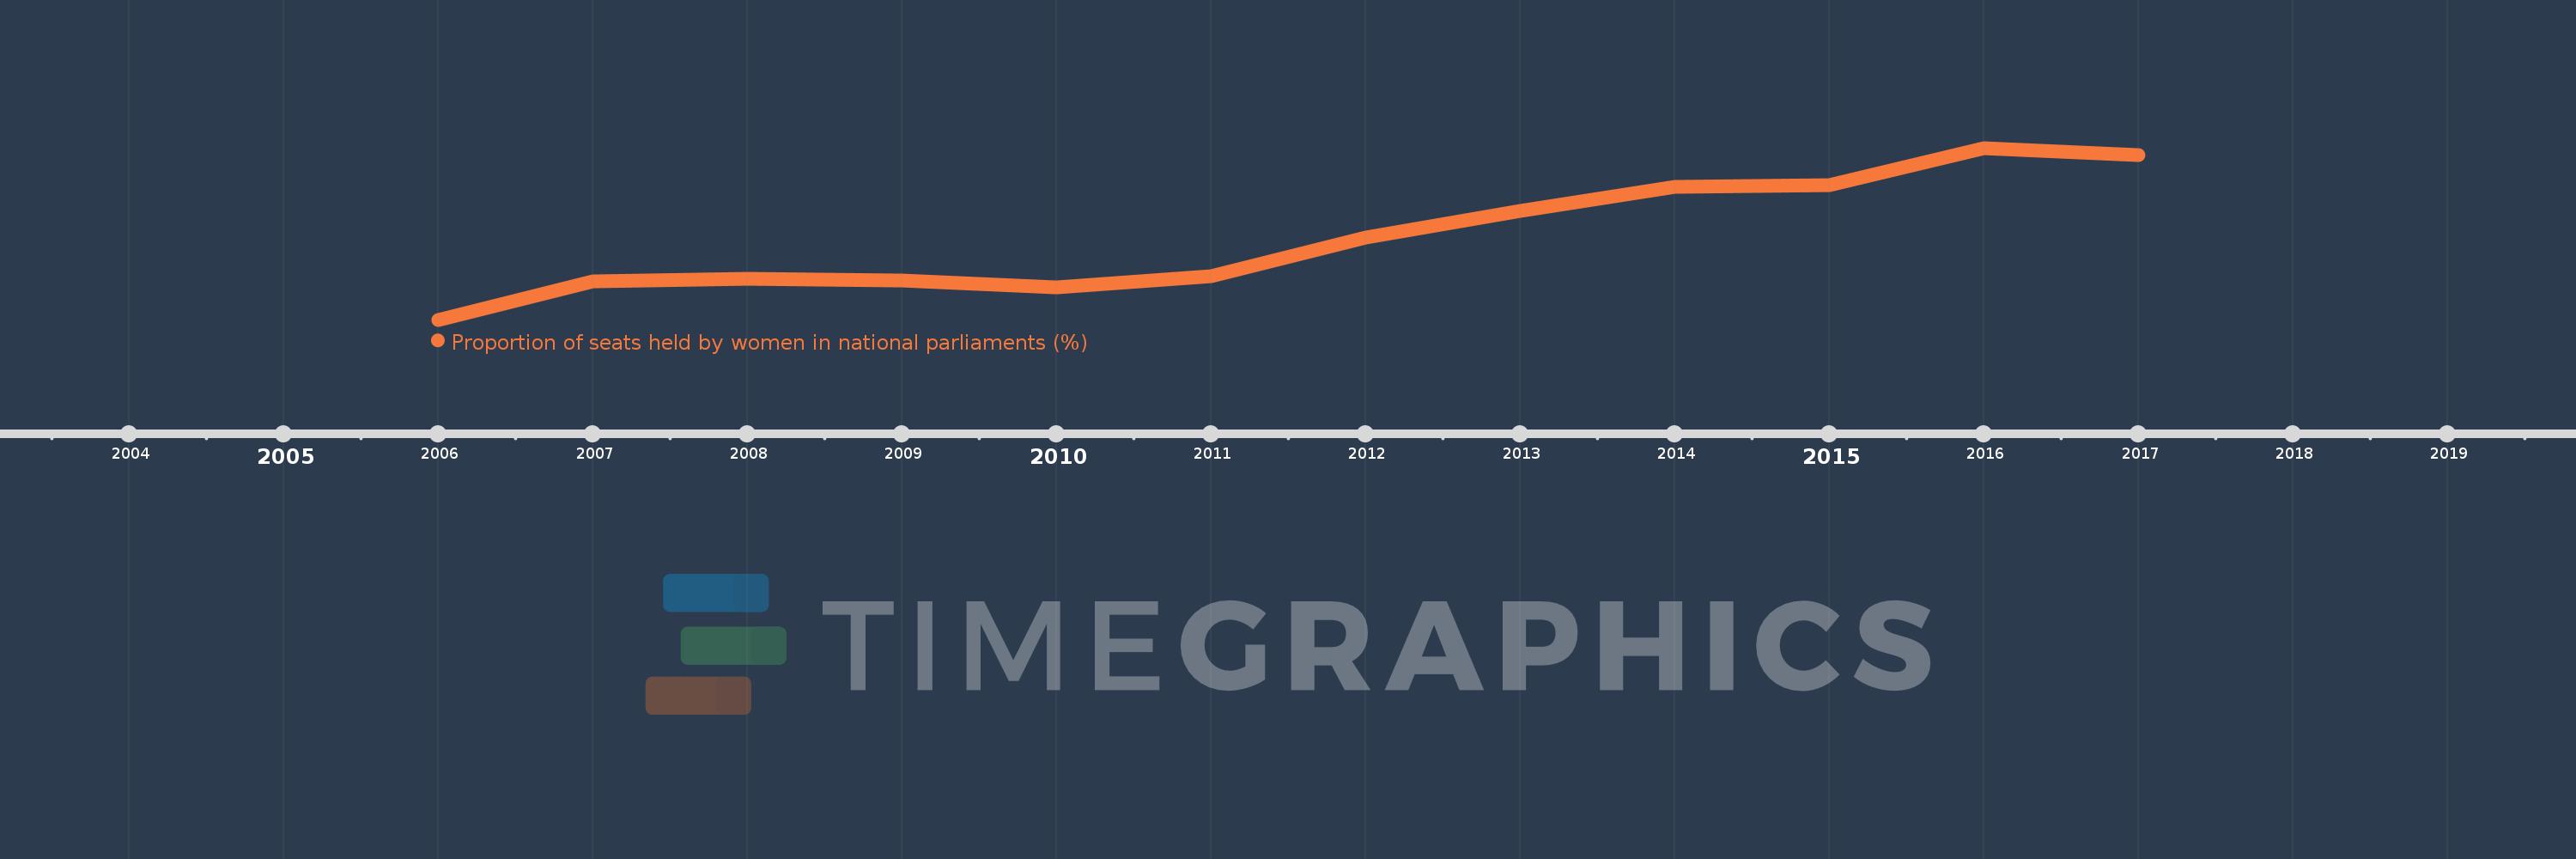
This timeline shows a graph from 2006 to 2017 of Fragile and conflict affected situations. No data until 2005. Number of actual observations by date: 12.
Source name:
World Development Indicators
Source organization:
Inter-Parliamentary Union (IPU) (www.ipu.org).
Categories, topics:
Public Sector, Gender, Social Development
Last updated:
apr 23, 2017
Indicators value changes by year
Meaning:
13.294
Minimum:
10.343
jan 1, 2006
Maximum:
16.493
jan 1, 2016
At the date of observation
Value
Absolute change
Change from the previous value
jan 1, 2006
10.343
+10.343
0.0%
jan 1, 2007
11.712
+1.369
13.24%
jan 1, 2008
11.803
+0.091
0.78%
jan 1, 2009
11.759
-0.044
-0.37%
jan 1, 2010
11.513
-0.247
-2.1%
jan 1, 2011
11.895
+0.383
3.32%
jan 1, 2012
13.274
+1.379
11.59%
jan 1, 2013
14.234
+0.96
7.23%
jan 1, 2014
15.107
+0.874
6.14%
jan 1, 2015
15.159
+0.052
0.34%
jan 1, 2016
16.493
+1.334
8.8%
jan 1, 2017
16.234
-0.259
-1.57%
Ranking of countries by current statistics by years