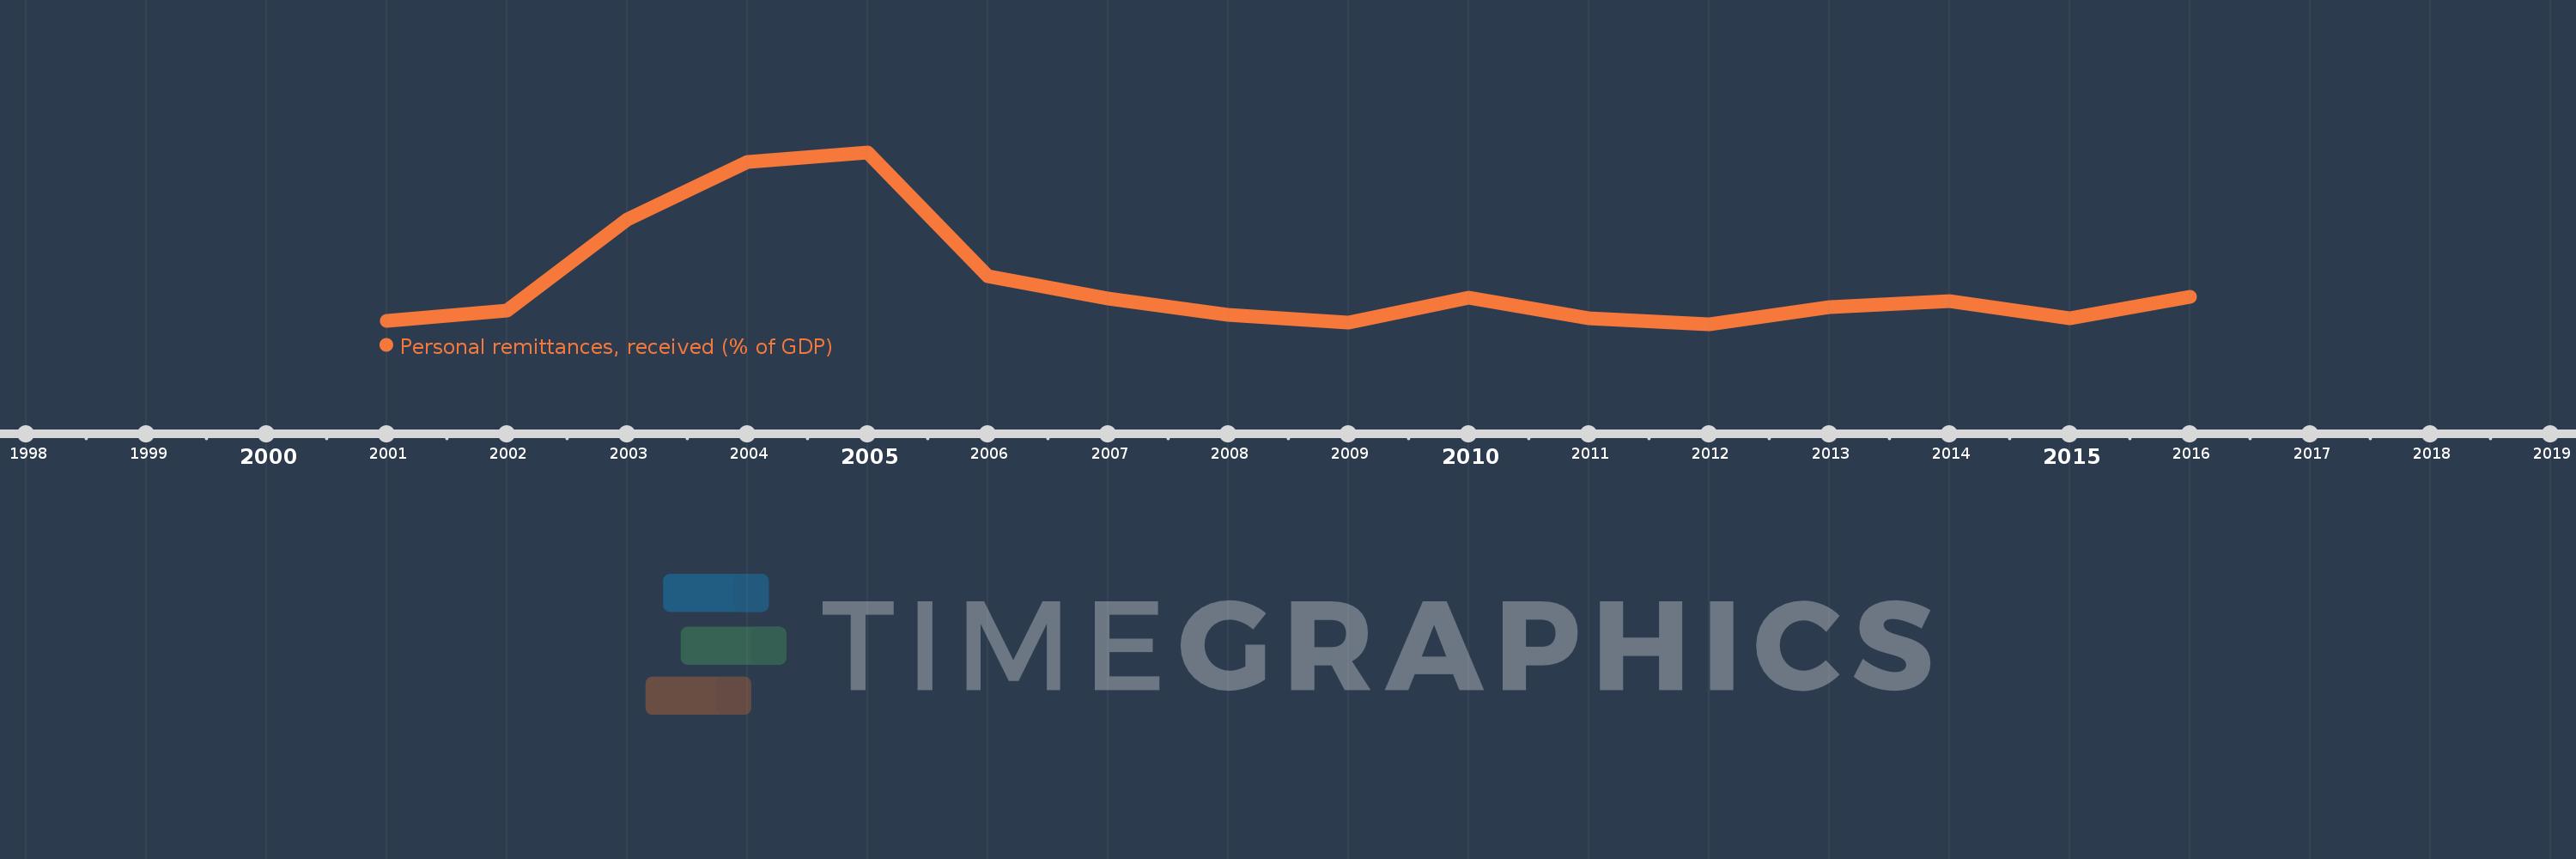
This timeline shows a graph from 2001 to 2016 of Fragile and conflict affected situations. No data until 2000. Number of actual observations by date: 16.
Source name:
World Development Indicators
Source organization:
World Bank staff estimates based on IMF balance of payments data, and World Bank and OECD GDP estimates.
Categories, topics:
Economy & Growth, Financial Sector
Last updated:
apr 23, 2017
Indicators value changes by year
Meaning:
4.038
Minimum:
3.166
jan 1, 2012
Maximum:
6.88
jan 1, 2005
At the date of observation
Value
Absolute change
Change from the previous value
jan 1, 2001
3.238
+3.238
0.0%
jan 1, 2002
3.452
+0.213
6.58%
jan 1, 2003
5.436
+1.985
57.5%
jan 1, 2004
6.68
+1.244
22.88%
jan 1, 2005
6.88
+0.2
2.99%
jan 1, 2006
4.197
-2.684
-39.01%
jan 1, 2007
3.721
-0.475
-11.32%
jan 1, 2008
3.361
-0.361
-9.69%
jan 1, 2009
3.205
-0.156
-4.63%
jan 1, 2010
3.742
+0.537
16.75%
jan 1, 2011
3.296
-0.446
-11.91%
jan 1, 2012
3.166
-0.13
-3.95%
jan 1, 2013
3.533
+0.366
11.57%
jan 1, 2014
3.665
+0.132
3.73%
jan 1, 2015
3.286
-0.378
-10.33%
jan 1, 2016
3.75
+0.464
14.12%
Ranking of countries by current statistics by years