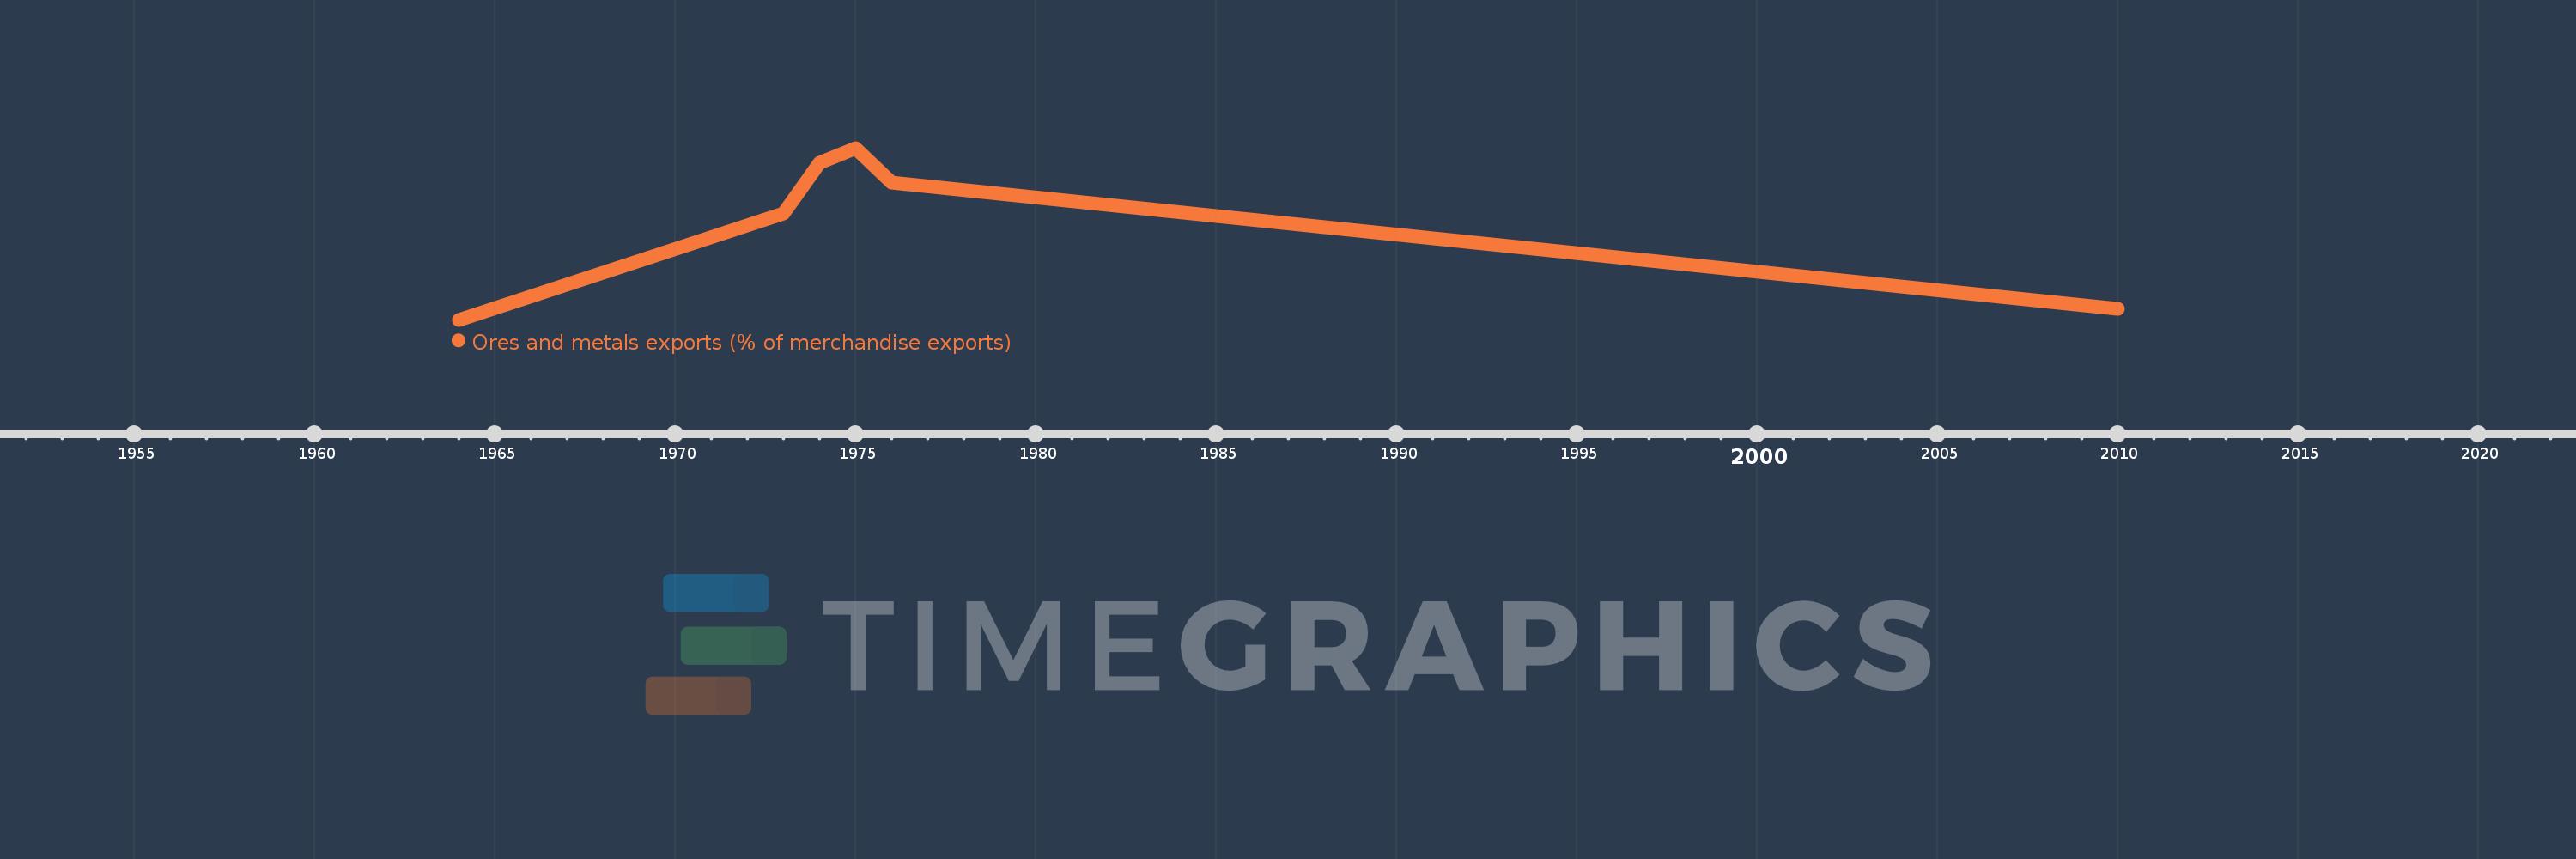
This timeline shows a graph from 1964 to 2010 of Fragile and conflict affected situations. No data until 1963. Number of actual observations by date: 6.
Source name:
World Development Indicators
Source organization:
World Bank staff estimates from the Comtrade database maintained by the United Nations Statistics Division.
Categories, topics:
Energy & Mining, Private Sector, Trade
Last updated:
apr 23, 2017
Indicators value changes by year
Meaning:
4.392
Minimum:
0.742
jan 1, 1964
Maximum:
7.191
jan 1, 1975
At the date of observation
Value
Absolute change
Change from the previous value
jan 1, 1964
0.742
+0.742
0.0%
jan 1, 1973
4.718
+3.976
535.89%
jan 1, 1974
6.629
+1.911
40.49%
jan 1, 1975
7.191
+0.563
8.49%
jan 1, 1976
5.907
-1.284
-17.85%
jan 1, 2010
1.166
-4.741
-80.26%
Ranking of countries by current statistics by years