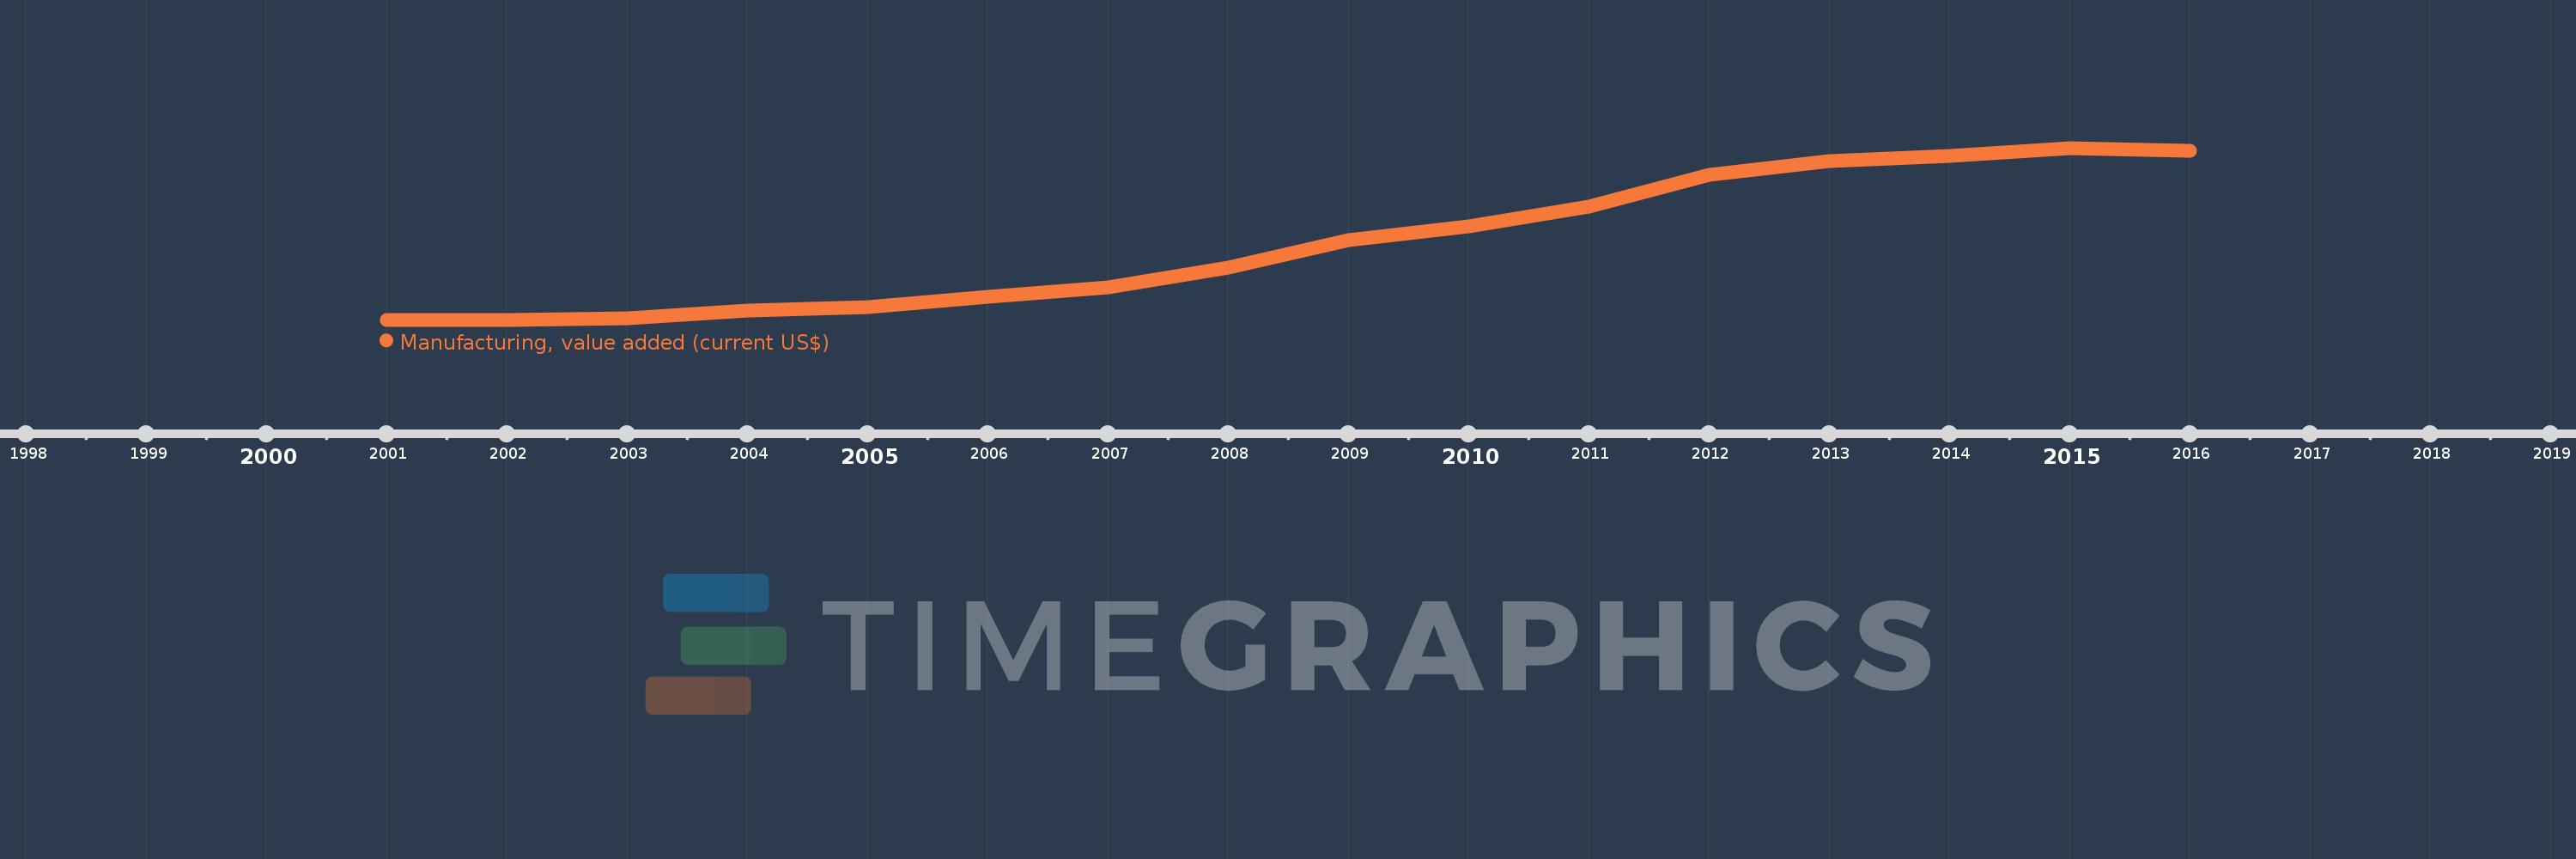
This timeline shows a graph from 2001 to 2016 of Fragile and conflict affected situations. No data until 2000. Number of actual observations by date: 16.
Source name:
World Development Indicators
Source organization:
World Bank national accounts data, and OECD National Accounts data files.
Categories, topics:
Economy & Growth
Last updated:
apr 23, 2017
Indicators value changes by year
Meaning:
34.844 bln
Minimum:
13.262 bln
jan 1, 2001
Maximum:
61.65 bln
jan 1, 2015
At the date of observation
Value
Absolute change
Change from the previous value
jan 1, 2001
13.262 bln
+13.262 bln
0.0%
jan 1, 2002
13.269 bln
+6.806 mln
0.05%
jan 1, 2003
13.761 bln
+491.738 mln
3.71%
jan 1, 2004
15.903 bln
+2.142 bln
15.57%
jan 1, 2005
16.936 bln
+1.034 bln
6.5%
jan 1, 2006
19.743 bln
+2.807 bln
16.58%
jan 1, 2007
22.379 bln
+2.636 bln
13.35%
jan 1, 2008
27.954 bln
+5.574 bln
24.91%
jan 1, 2009
35.769 bln
+7.815 bln
27.96%
jan 1, 2010
39.526 bln
+3.756 bln
10.5%
jan 1, 2011
45.207 bln
+5.682 bln
14.38%
jan 1, 2012
54.022 bln
+8.815 bln
19.5%
jan 1, 2013
57.981 bln
+3.959 bln
7.33%
jan 1, 2014
59.381 bln
+1.399 bln
2.41%
jan 1, 2015
61.65 bln
+2.27 bln
3.82%
jan 1, 2016
60.755 bln
-895.743 mln
-1.45%
Ranking of countries by current statistics by years