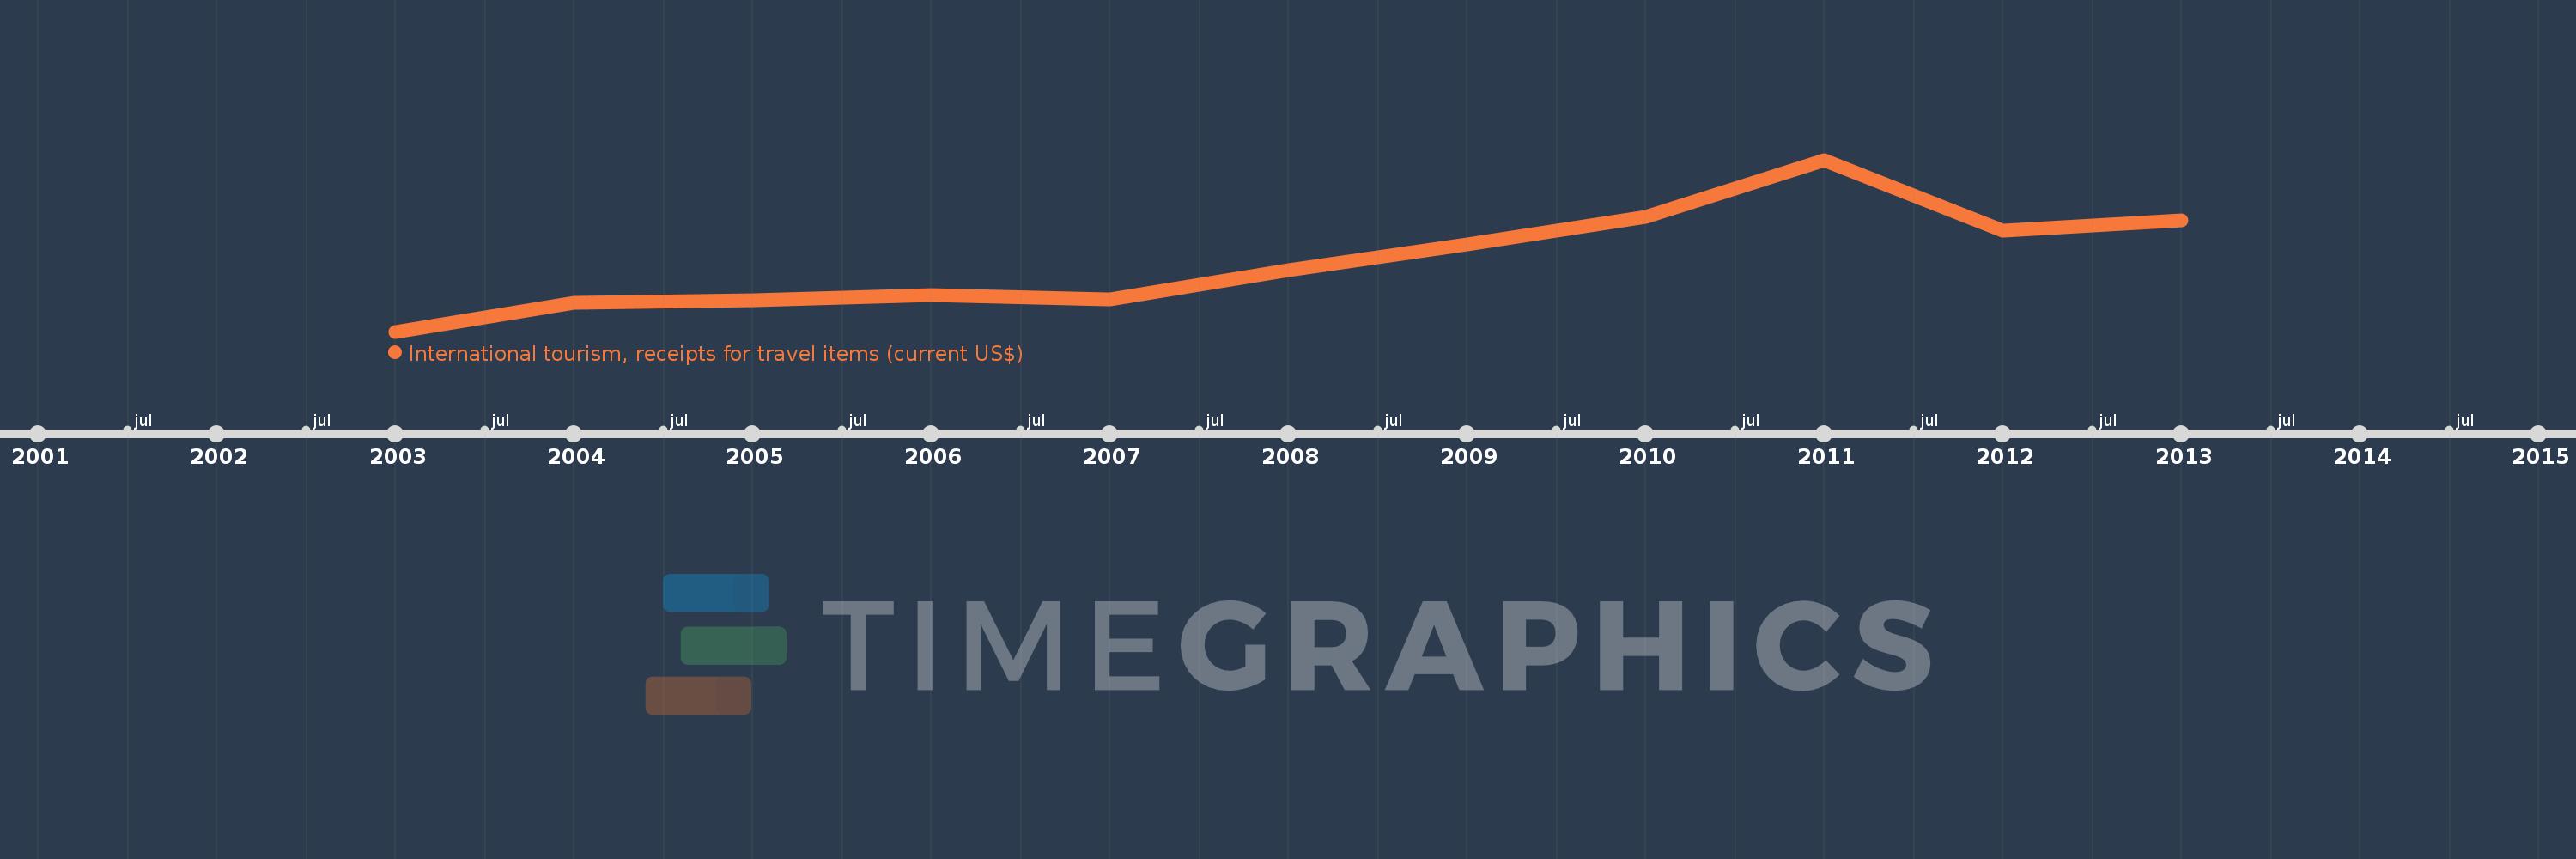
This timeline shows a graph from 2003 to 2013 of Fragile and conflict affected situations. No data until 2002. Number of actual observations by date: 11.
Source name:
World Development Indicators
Source organization:
World Tourism Organization, Yearbook of Tourism Statistics, Compendium of Tourism Statistics and data files.
Categories, topics:
Private Sector, Trade
Last updated:
apr 23, 2017
Indicators value changes by year
Meaning:
12.739 bln
Minimum:
7.025 bln
jan 1, 2003
Maximum:
20.915 bln
jan 1, 2011
At the date of observation
Value
Absolute change
Change from the previous value
jan 1, 2003
7.025 bln
+7.025 bln
0.0%
jan 1, 2004
9.357 bln
+2.333 bln
33.21%
jan 1, 2005
9.554 bln
+196.724 mln
2.1%
jan 1, 2006
10.002 bln
+447.717 mln
4.69%
jan 1, 2007
9.635 bln
-366.324 mln
-3.66%
jan 1, 2008
11.976 bln
+2.341 bln
24.29%
jan 1, 2009
14.103 bln
+2.127 bln
17.76%
jan 1, 2010
16.321 bln
+2.218 bln
15.72%
jan 1, 2011
20.915 bln
+4.595 bln
28.15%
jan 1, 2012
15.219 bln
-5.696 bln
-27.24%
jan 1, 2013
16.019 bln
+799.559 mln
5.25%
Ranking of countries by current statistics by years