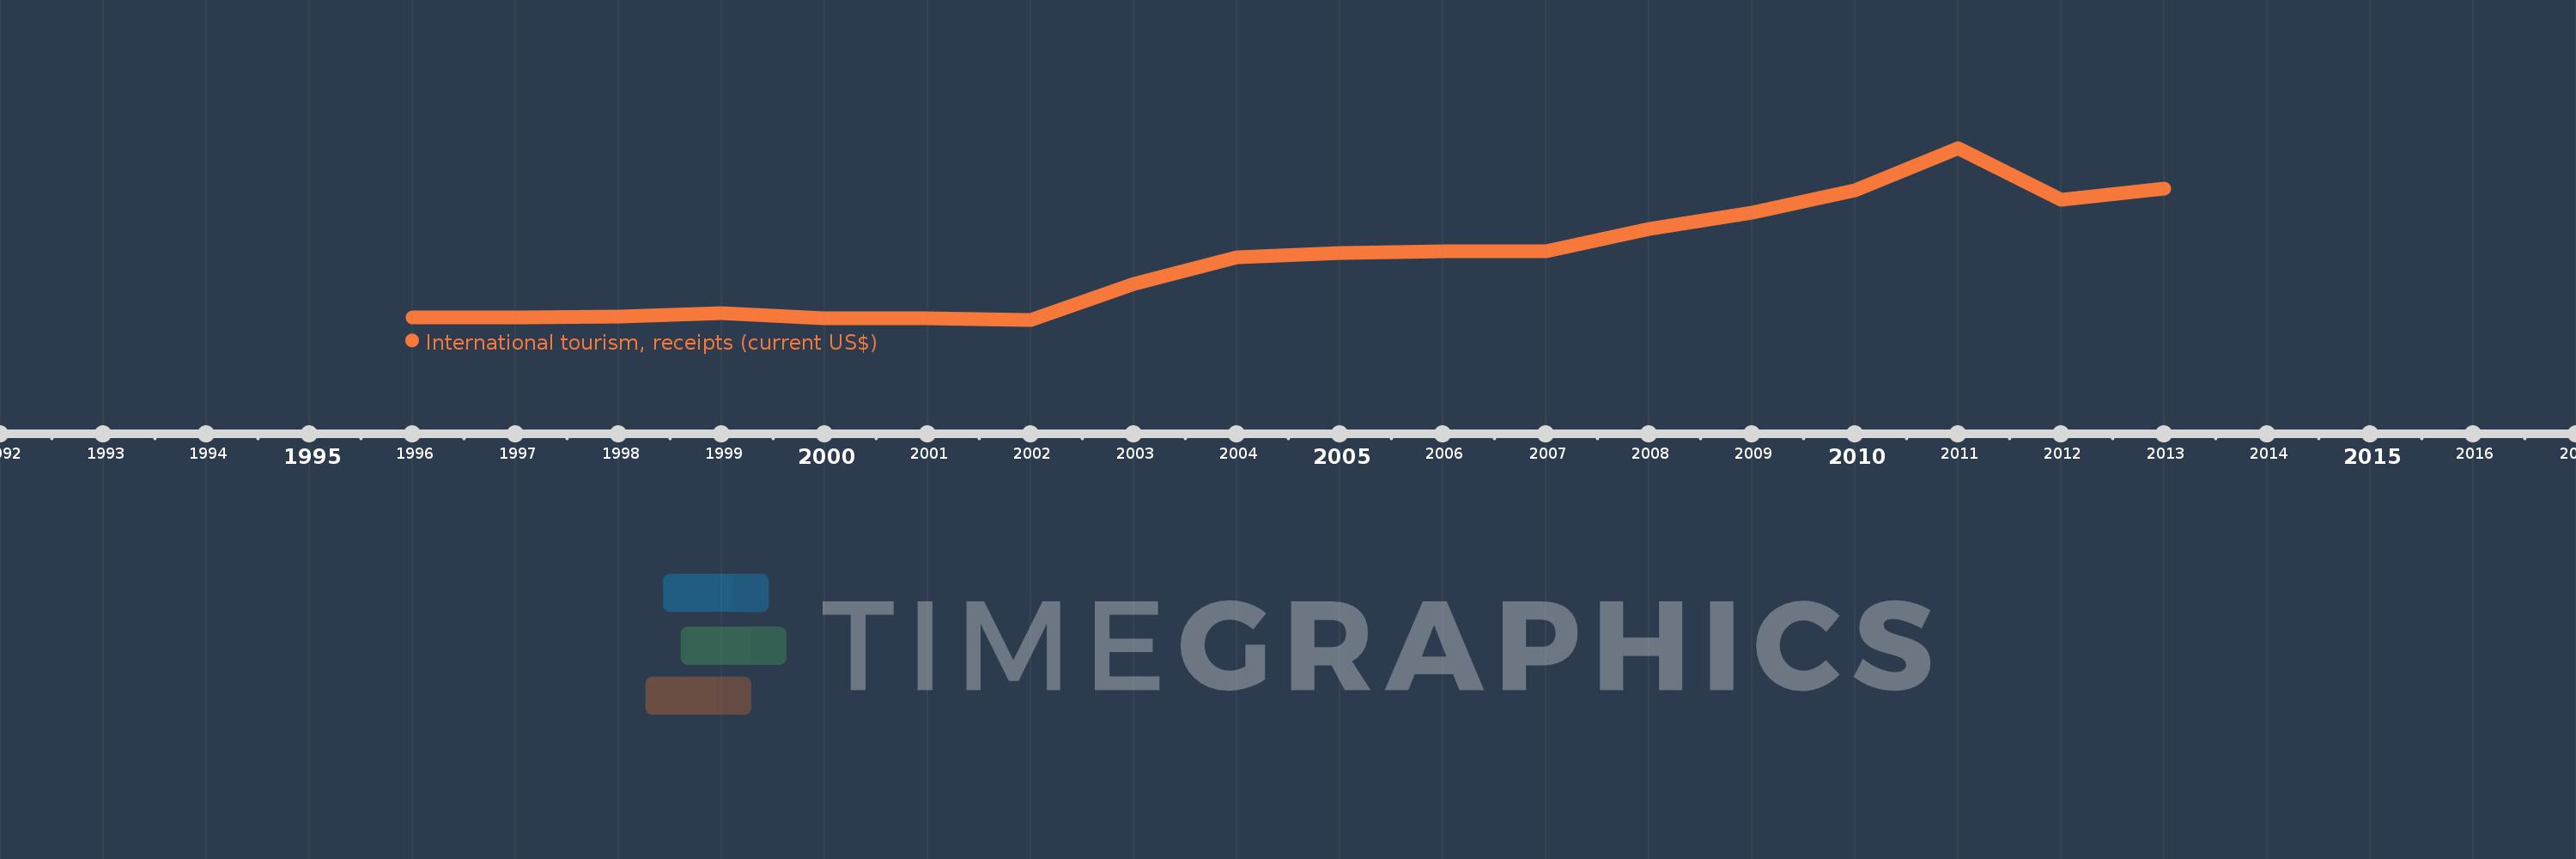
This timeline shows a graph from 1996 to 2013 of Fragile and conflict affected situations. No data until 1995. Number of actual observations by date: 18.
Source name:
World Development Indicators
Source organization:
World Tourism Organization, Yearbook of Tourism Statistics, Compendium of Tourism Statistics and data files.
Categories, topics:
Private Sector, Trade
Last updated:
apr 23, 2017
Indicators value changes by year
Meaning:
9.738 bln
Minimum:
3.287 bln
jan 1, 2002
Maximum:
21.936 bln
jan 1, 2011
At the date of observation
Value
Absolute change
Change from the previous value
jan 1, 1996
3.502 bln
+3.502 bln
0.0%
jan 1, 1997
3.53 bln
+28.168 mln
0.8%
jan 1, 1998
3.633 bln
+103.36 mln
2.93%
jan 1, 1999
3.995 bln
+361.748 mln
9.96%
jan 1, 2000
3.49 bln
-505.336 mln
-12.65%
jan 1, 2001
3.437 bln
-53.123 mln
-1.52%
jan 1, 2002
3.287 bln
-149.852 mln
-4.36%
jan 1, 2003
7.17 bln
+3.884 bln
118.16%
jan 1, 2004
10.055 bln
+2.885 bln
40.24%
jan 1, 2005
10.549 bln
+493.123 mln
4.9%
jan 1, 2006
10.731 bln
+182.728 mln
1.73%
jan 1, 2007
10.676 bln
-55.578 mln
-0.52%
jan 1, 2008
13.12 bln
+2.444 bln
22.9%
jan 1, 2009
14.932 bln
+1.812 bln
13.81%
jan 1, 2010
17.334 bln
+2.402 bln
16.08%
jan 1, 2011
21.936 bln
+4.602 bln
26.55%
jan 1, 2012
16.355 bln
-5.581 bln
-25.44%
jan 1, 2013
17.553 bln
+1.198 bln
7.33%
Ranking of countries by current statistics by years