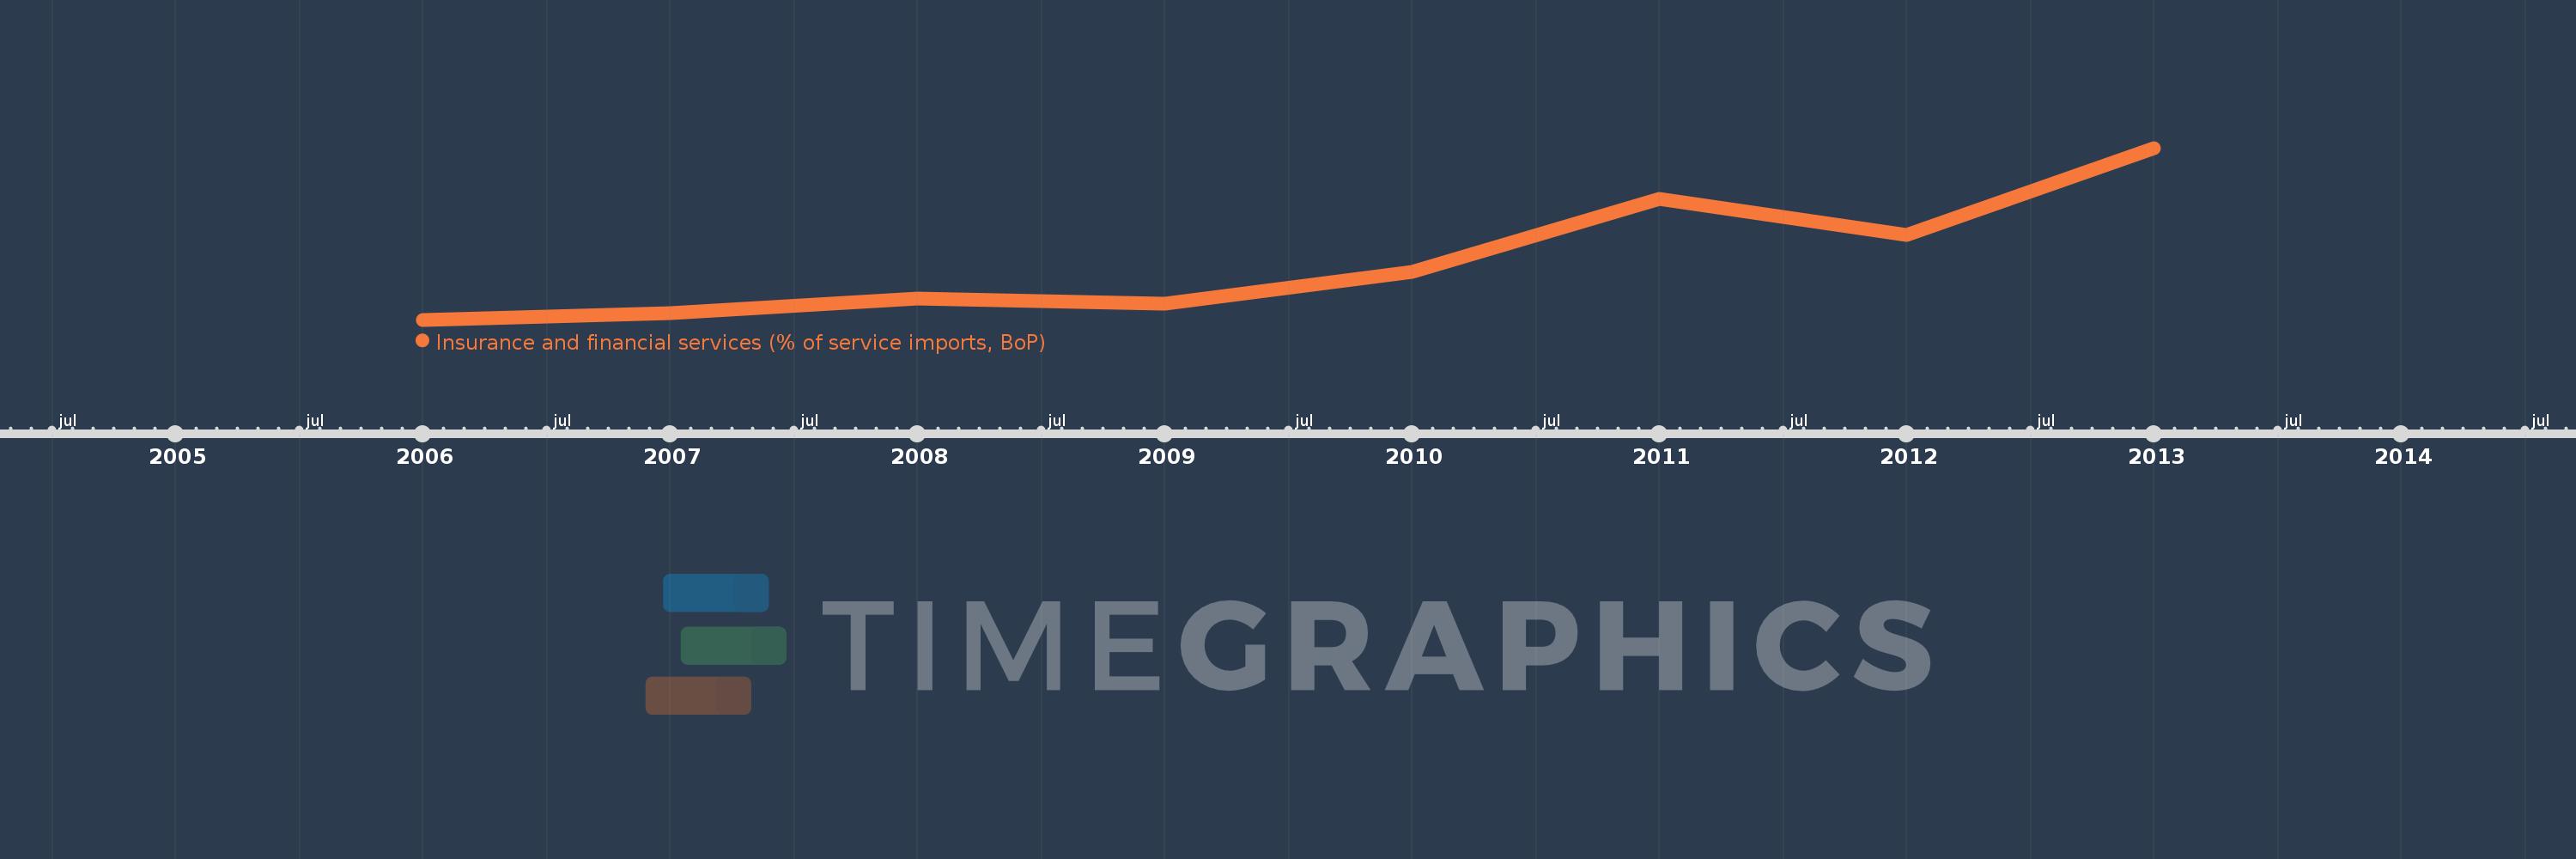
This timeline shows a graph from 2006 to 2013 of Fragile and conflict affected situations. No data until 2005. Number of actual observations by date: 8.
Source name:
World Development Indicators
Source organization:
International Monetary Fund, Balance of Payments Statistics Yearbook and data files.
Categories, topics:
Economy & Growth, Private Sector, Trade
Last updated:
apr 23, 2017
Indicators value changes by year
Meaning:
9.941
Minimum:
7.814
jan 1, 2006
Maximum:
14.033
jan 1, 2013
At the date of observation
Value
Absolute change
Change from the previous value
jan 1, 2006
7.814
+7.814
0.0%
jan 1, 2007
8.067
+0.253
3.23%
jan 1, 2008
8.595
+0.528
6.54%
jan 1, 2009
8.394
-0.201
-2.34%
jan 1, 2010
9.546
+1.153
13.74%
jan 1, 2011
12.195
+2.649
27.75%
jan 1, 2012
10.884
-1.311
-10.75%
jan 1, 2013
14.033
+3.149
28.93%
Ranking of countries by current statistics by years