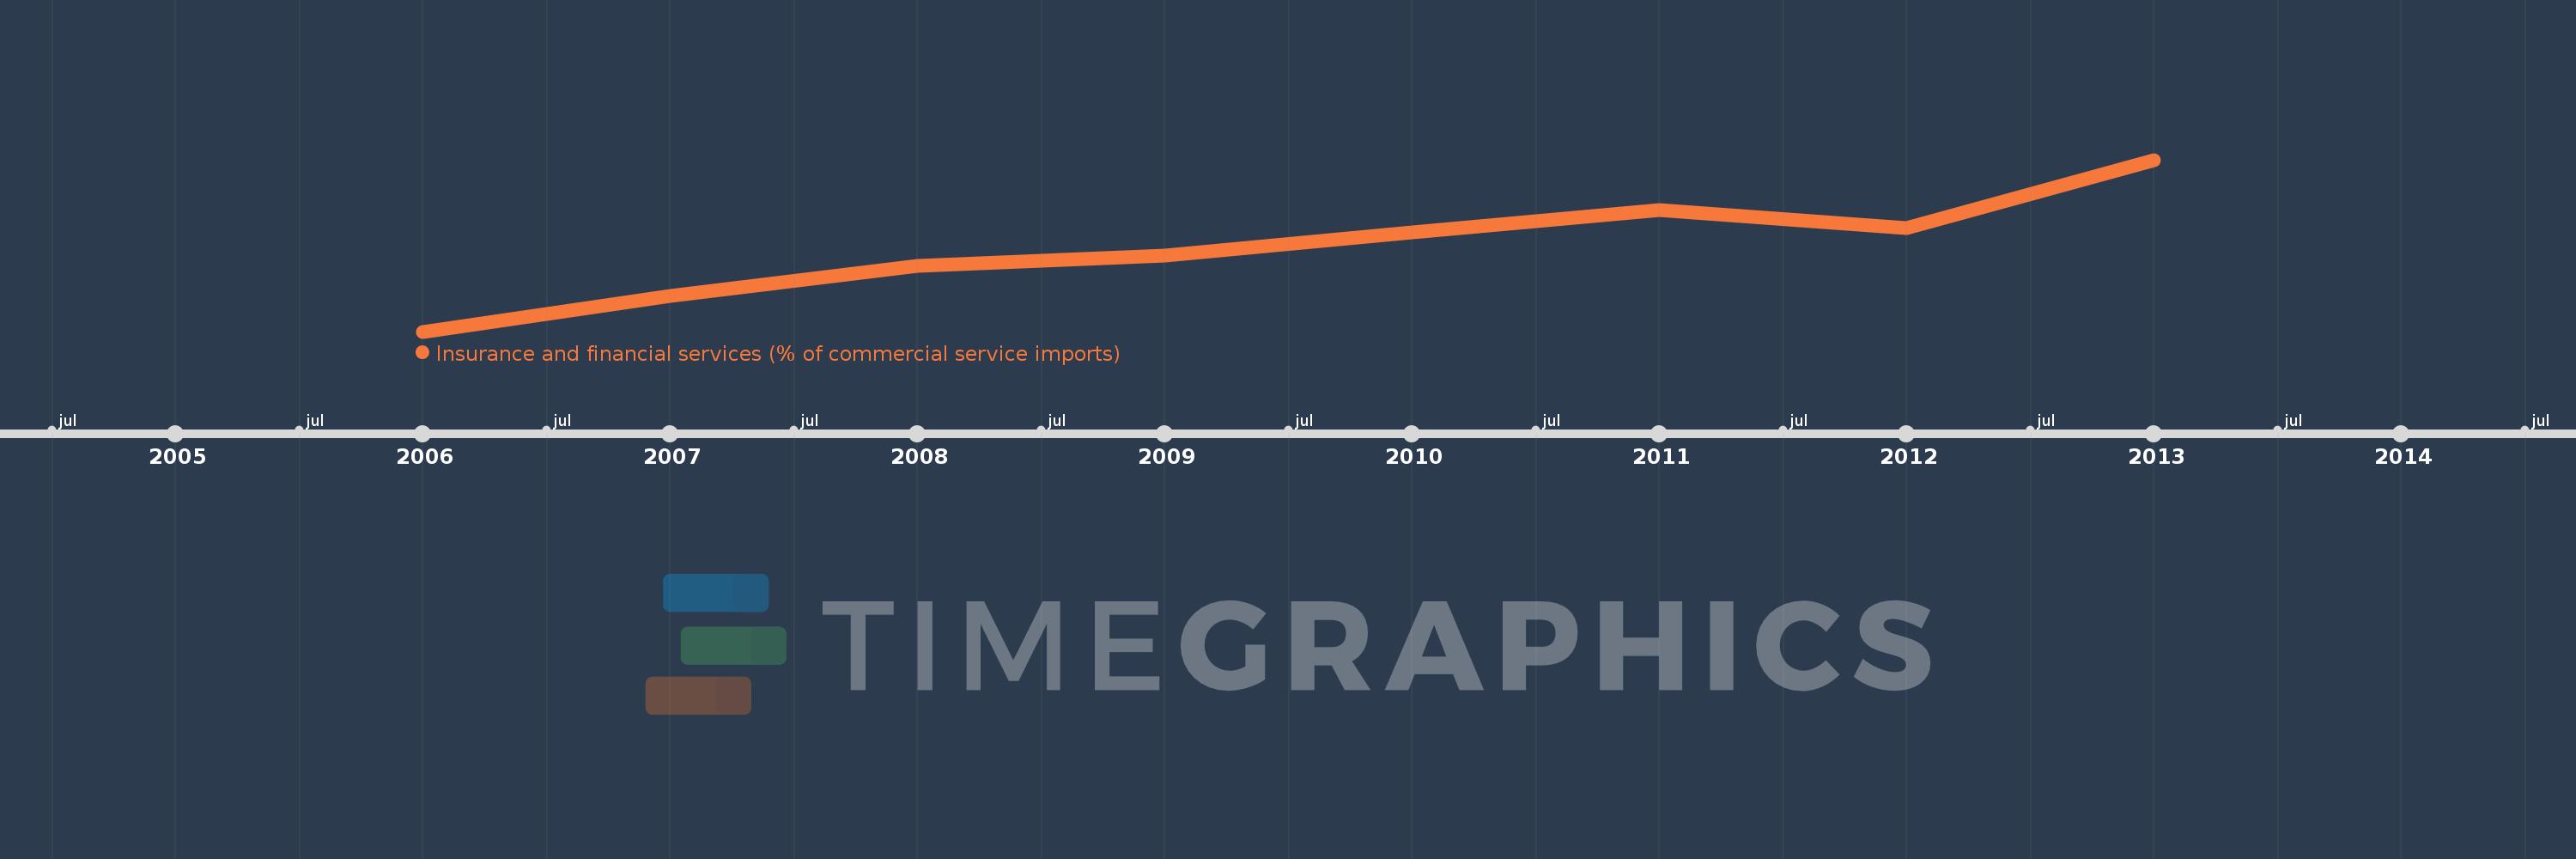
This timeline shows a graph from 2006 to 2013 of Fragile and conflict affected situations. No data until 2005. Number of actual observations by date: 8.
Source name:
World Development Indicators
Source organization:
International Monetary Fund, Balance of Payments Statistics Yearbook and data files.
Categories, topics:
Private Sector, Trade
Last updated:
apr 23, 2017
Indicators value changes by year
Meaning:
12.905
Minimum:
10.024
jan 1, 2006
Maximum:
15.901
jan 1, 2013
At the date of observation
Value
Absolute change
Change from the previous value
jan 1, 2006
10.024
+10.024
0.0%
jan 1, 2007
11.235
+1.212
12.09%
jan 1, 2008
12.264
+1.028
9.15%
jan 1, 2009
12.638
+0.375
3.05%
jan 1, 2010
13.422
+0.784
6.2%
jan 1, 2011
14.182
+0.76
5.66%
jan 1, 2012
13.571
-0.61
-4.3%
jan 1, 2013
15.901
+2.33
17.17%
Ranking of countries by current statistics by years