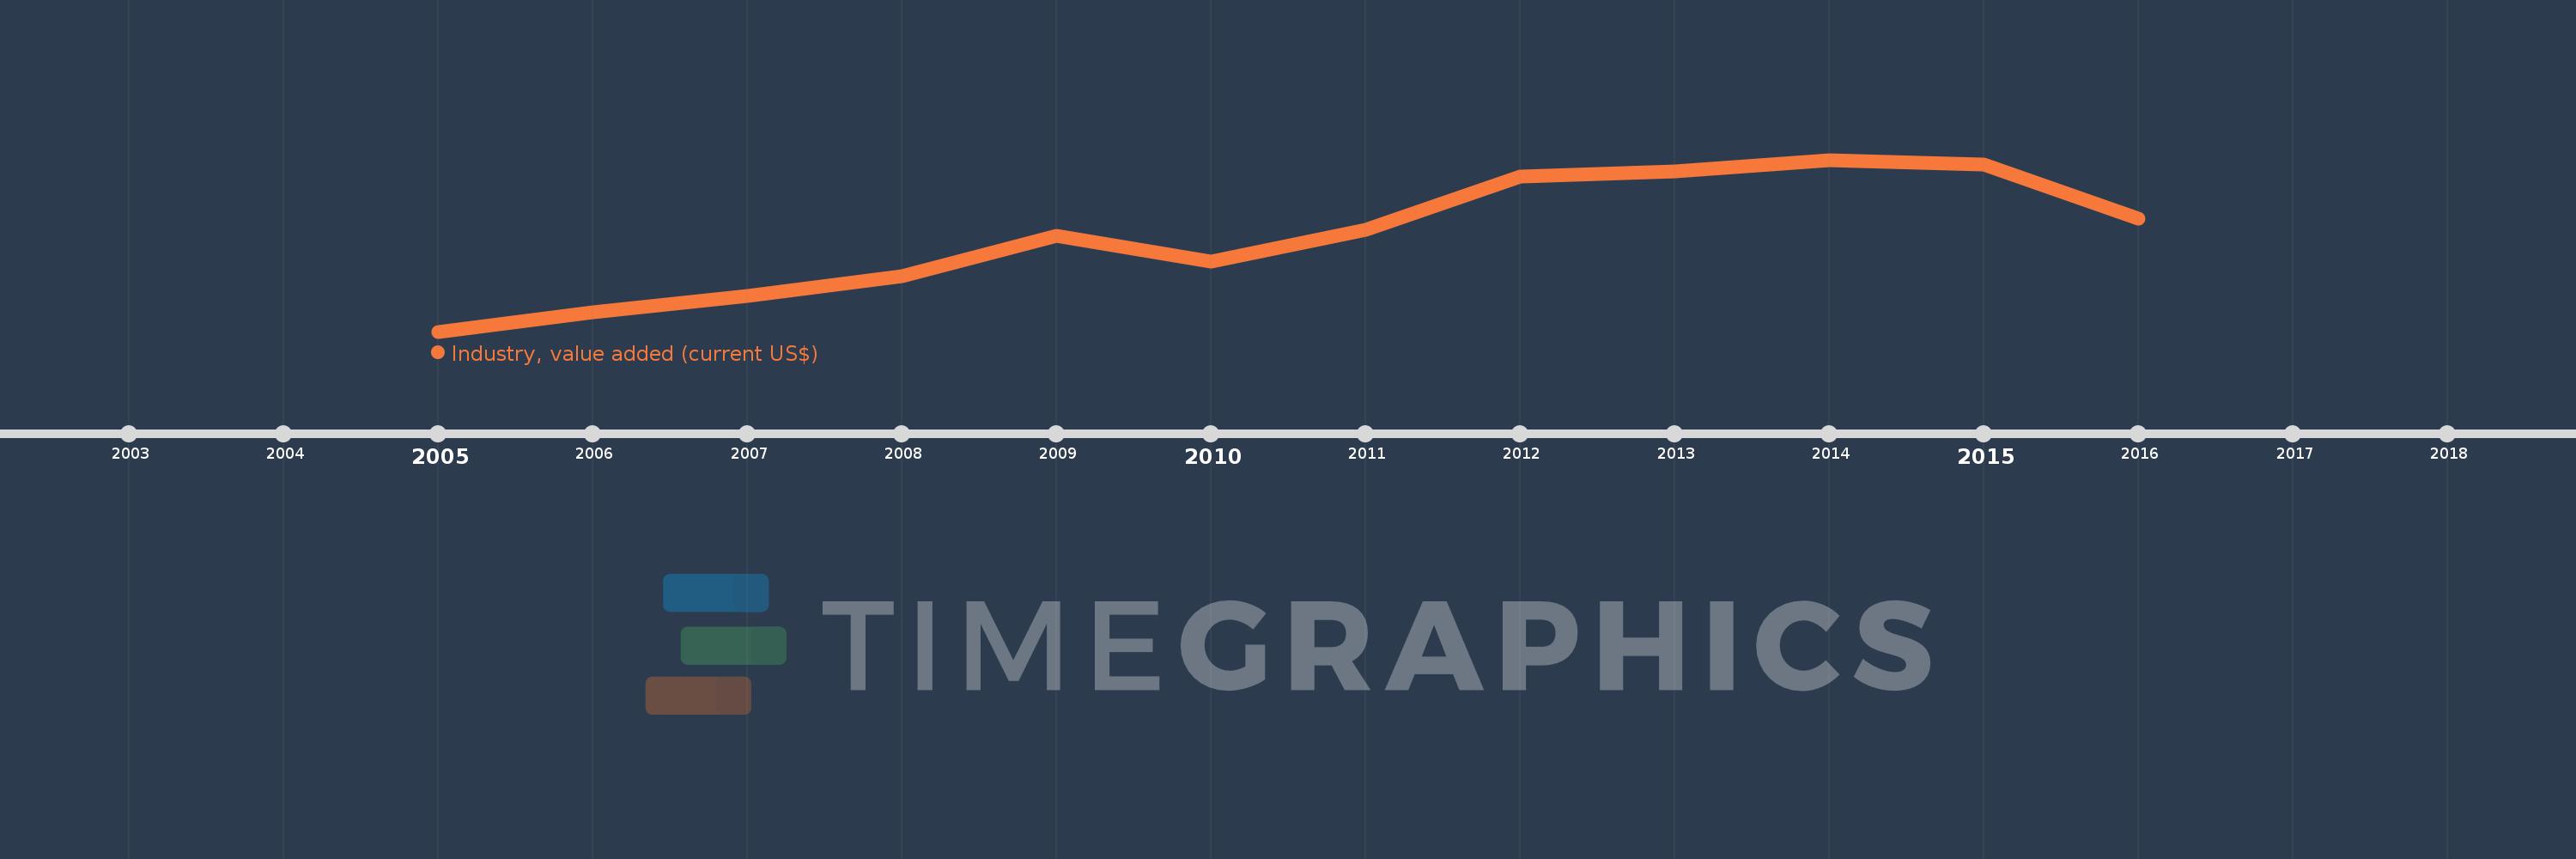
This timeline shows a graph from 2005 to 2016 of Fragile and conflict affected situations. No data until 2004. Number of actual observations by date: 12.
Source name:
World Development Indicators
Source organization:
World Bank national accounts data, and OECD National Accounts data files.
Categories, topics:
Economy & Growth
Last updated:
apr 23, 2017
Indicators value changes by year
Meaning:
195.749 bln
Minimum:
74.373 bln
jan 1, 2005
Maximum:
292.783 bln
jan 1, 2014
At the date of observation
Value
Absolute change
Change from the previous value
jan 1, 2005
74.373 bln
+74.373 bln
0.0%
jan 1, 2006
98.464 bln
+24.091 bln
32.39%
jan 1, 2007
120.151 bln
+21.687 bln
22.03%
jan 1, 2008
145.323 bln
+25.172 bln
20.95%
jan 1, 2009
196.061 bln
+50.738 bln
34.91%
jan 1, 2010
163.277 bln
-32.784 bln
-16.72%
jan 1, 2011
204.213 bln
+40.936 bln
25.07%
jan 1, 2012
271.911 bln
+67.698 bln
33.15%
jan 1, 2013
278.223 bln
+6.312 bln
2.32%
jan 1, 2014
292.783 bln
+14.561 bln
5.23%
jan 1, 2015
286.421 bln
-6.362 bln
-2.17%
jan 1, 2016
217.782 bln
-68.639 bln
-23.96%
Ranking of countries by current statistics by years